
Distributed tracing with OpenTelemetry and Tempo
Contents
This is part 9 of the Production Observability series. Metrics tell you what is wrong. Logs tell you what happened. Traces tell you where in a distributed system the time went. This post adds the third pillar.
By now the demo system runs four services: order-service, inventory-service, payment-service, and notification-service. A single POST /orders call fans out across all four. Without tracing, you know the request is slow — but you can only see the total time in order-service metrics. You cannot tell whether the slowness lives in order-service itself, in the inventory check, in the payment charge, or in the notification call. Traces answer that question directly.
What traces are
A trace is a record of a request’s journey through a system. Each step the request takes is a span: a named unit of work with a start time, a duration, and metadata. Spans that belong to the same request share a trace ID.
A trace looks like a tree. The root span is the inbound HTTP request. Its children are the operations it triggered: downstream service calls, database queries, background work. Each child can have its own children.
Trace ID: a3b7c9...

[order-service]       POST /orders                   0ms ─────────────────────── 342ms
  [order-service]       process_order                1ms ─────────────────────── 341ms
    [order-service]       validate_order             2ms ─ 4ms
    [order-service]       check_inventory           10ms ─── 18ms
      [inventory-service]   GET /stock/book         11ms ─ 17ms
    [order-service]       reserve_inventory         20ms ──────────────────────── 308ms
      [inventory-service]   POST /stock/book/reserve 21ms ─────────────── 306ms
        [inventory-service]   reserve_stock          22ms ─────────────── 305ms
          [inventory-service]   slow_lookup          23ms ─────────────── 304ms  ← 269ms in here
    [order-service]       charge_payment            310ms ── 327ms
      [payment-service]     POST /charges           311ms ─ 325ms
    [order-service]       send_notification         328ms ─ 334ms
      [notification-service] POST /notify           329ms ─ 333ms
From this flame graph you can immediately see: 87% of the total request time was spent inside inventory-service’s slow_lookup span. Without tracing you would look at order-service metrics and see slow POST /orders — but nothing in those metrics would point you at inventory-service.

For a monolith, traces are useful but not essential: logs often tell you enough. For a system where requests cross service boundaries, traces are indispensable. There is no other way to reconstruct the causal chain.
OpenTelemetry
OpenTelemetry (OTel) is a vendor-neutral observability framework — an SDK, a wire protocol, and a set of conventions. It is the CNCF standard for emitting telemetry from applications. By instrumenting your service with the OTel SDK, you can send traces (and metrics, and logs) to any OTel-compatible backend — Tempo, Jaeger, Datadog, Sentry — without changing your application code.
The OTel SDK has two instrumentation modes:
Auto-instrumentation instruments known libraries automatically. For FastAPI, the OTel FastAPI instrumentation hooks into the ASGI lifecycle and creates a span for every request without you writing any span code.
Manual instrumentation lets you add custom spans for operations that auto-instrumentation does not cover: database queries, background jobs, business logic.

Python dependencies
opentelemetry-sdk==1.41.1
opentelemetry-api==1.41.1
opentelemetry-exporter-otlp-proto-grpc==1.41.1
opentelemetry-instrumentation-fastapi==0.62b1
opentelemetry-instrumentation-requests==0.62b1
Setting up tracing
The tracer.py file is the same for all four services — the only difference is the SERVICE_NAME environment variable, which controls the service.name resource attribute that Tempo and Grafana use to identify the service.
tracer.py (shared across all services):
import os
from opentelemetry import trace
from opentelemetry.sdk.trace import TracerProvider
from opentelemetry.sdk.trace.export import BatchSpanProcessor
from opentelemetry.exporter.otlp.proto.grpc.trace_exporter import OTLPSpanExporter
from opentelemetry.instrumentation.fastapi import FastAPIInstrumentor
from opentelemetry.instrumentation.requests import RequestsInstrumentor
from opentelemetry.sdk.resources import Resource

def setup_tracing():
    service_name = os.getenv("SERVICE_NAME", "unknown-service")
    resource = Resource.create({"service.name": service_name})

    provider = TracerProvider(resource=resource)
    trace.set_tracer_provider(provider)

    endpoint = os.getenv("OTEL_EXPORTER_OTLP_ENDPOINT", "http://otel-collector:4317")
    exporter = OTLPSpanExporter(endpoint=endpoint, insecure=True)
    provider.add_span_processor(BatchSpanProcessor(exporter))

    RequestsInstrumentor().instrument()

def instrument_app(app) -> None:
    FastAPIInstrumentor.instrument_app(app, excluded_urls="/metrics,/health")
Call setup_tracing() at module level, then call instrument_app(app) on the FastAPI instance after it is created:
# main.py (same pattern in each service)
from tracer import setup_tracing, instrument_app

setup_tracing()          # sets up TracerProvider and RequestsInstrumentor

app = FastAPI()
instrument_app(app)      # adds OTel middleware to this specific app instance
Each service’s docker-compose.yml entry sets SERVICE_NAME:
  order-service:
    environment:
      SERVICE_NAME: order-service
      INVENTORY_SERVICE_URL: http://inventory-service:8002
      PAYMENT_SERVICE_URL: http://payment-service:8003
      NOTIFICATION_SERVICE_URL: http://notification-service:8004
      OTEL_EXPORTER_OTLP_ENDPOINT: http://otel-collector:4317

  inventory-service:
    environment:
      SERVICE_NAME: inventory-service
      OTEL_EXPORTER_OTLP_ENDPOINT: http://otel-collector:4317

  payment-service:
    environment:
      SERVICE_NAME: payment-service
      OTEL_EXPORTER_OTLP_ENDPOINT: http://otel-collector:4317

  notification-service:
    environment:
      SERVICE_NAME: notification-service
      OTEL_EXPORTER_OTLP_ENDPOINT: http://otel-collector:4317
The Resource carries service.name into every span. This is the primary grouping attribute in Tempo: when you open the Service Graph or filter by service in the Search tab, it reads service.name. Getting it right from the start matters — changing it later breaks trace continuity.
Manual spans
Auto-instrumentation handles HTTP requests and outbound requests calls automatically. For application-level operations, add spans manually. In order-service, the interesting spans are the ones that call downstream services:
from opentelemetry import trace
import requests as http

tracer = trace.get_tracer(__name__)

INVENTORY_URL = os.getenv("INVENTORY_SERVICE_URL", "http://inventory-service:8002")
PAYMENT_URL   = os.getenv("PAYMENT_SERVICE_URL",   "http://payment-service:8003")
NOTIFY_URL    = os.getenv("NOTIFICATION_SERVICE_URL", "http://notification-service:8004")

@app.post("/orders", status_code=201)
def create_order(req: OrderRequest):
    with tracer.start_as_current_span("process_order") as span:
        span.set_attribute("order.item", req.item)
        span.set_attribute("order.quantity", req.quantity)

        with tracer.start_as_current_span("validate_order"):
            if req.quantity <= 0:
                raise HTTPException(status_code=400, detail="Quantity must be positive")
            if req.price < 0:
                raise HTTPException(status_code=400, detail="Price must be non-negative")

        # Check available stock — RequestsInstrumentor injects traceparent header
        with tracer.start_as_current_span("check_inventory"):
            resp = http.get(f"{INVENTORY_URL}/stock/{req.item}")
            if resp.status_code != 200:
                raise HTTPException(status_code=502, detail="Inventory check failed")
            if resp.json()["available"] < req.quantity:
                raise HTTPException(status_code=409, detail="Insufficient stock")

        # Reserve the stock — this is the span that can be slow for high-demand items
        with tracer.start_as_current_span("reserve_inventory"):
            resp = http.post(f"{INVENTORY_URL}/stock/{req.item}/reserve",
                             json={"quantity": req.quantity})
            if resp.status_code != 200:
                raise HTTPException(status_code=502, detail="Inventory reserve failed")

        # Charge the customer
        with tracer.start_as_current_span("charge_payment"):
            resp = http.post(f"{PAYMENT_URL}/charges",
                             json={"item": req.item, "amount": req.price * req.quantity})
            if resp.status_code != 200:
                raise HTTPException(status_code=502, detail="Payment failed")

        order_id = str(uuid.uuid4())
        span.set_attribute("order.id", order_id)

        # Fire-and-forget notification — do not block the response on this
        with tracer.start_as_current_span("send_notification"):
            try:
                http.post(f"{NOTIFY_URL}/notify",
                          json={"order_id": order_id, "item": req.item},
                          timeout=0.5)
            except Exception:
                pass  # notification failure does not fail the order

        return {"order_id": order_id, "status": "created"}
In inventory-service, add a manual span for the slow lookup path so it is visible in traces:
# inventory-service/main.py
tracer = trace.get_tracer(__name__)

@app.post("/stock/{item}/reserve")
def reserve_stock(item: str, req: ReserveRequest):
    with tracer.start_as_current_span("reserve_stock") as span:
        span.set_attribute("inventory.item", item)
        span.set_attribute("inventory.quantity", req.quantity)

        with tracer.start_as_current_span("slow_lookup") as lookup_span:
            lookup_span.set_attribute("inventory.demand", "high" if req.quantity > 5 else "normal")
            # Simulate slow path for high-demand items
            latency = 0.27 if req.quantity > 5 else 0.02
            time.sleep(latency + random.uniform(0, 0.03))

        return {"item": item, "reserved": req.quantity}
Span attributes are key-value metadata stored with the span. Use OTel semantic conventions where they apply (db.operation, http.method, http.status_code) so Grafana and other tools can render them meaningfully. Add business attributes (order.item, inventory.demand) for domain context.
When creating a span inside a running handler, it automatically becomes a child of the current active span — the HTTP request span created by auto-instrumentation. No explicit parent reference is needed.
Context propagation
When one service calls another, the trace ID travels in an HTTP header, stitching spans from four separate processes into one trace tree:

Every HTTP call that order-service makes carries the traceparent header. The receiving service reads it, extracts the trace ID and parent span ID, and creates its own spans as children of that parent. All spans across all four services share the same trace ID — that is how Tempo assembles them into a single flame graph.
The header format is defined by the W3C TraceContext specification:
traceparent: 00-a3b7c9d2e1f04567-8901234abcdef567-01
              ^  ^^^^^^^^^^^^^^^^  ^^^^^^^^^^^^^^^^  ^^
              version  trace-id       parent-span   flags
RequestsInstrumentor (installed in tracer.py) automatically injects this header into every outbound requests HTTP call. The receiving service’s FastAPI instrumentation reads it, extracts the trace ID, and creates spans as children of the parent span. This is how traces chain across service boundaries.
If you use httpx instead of requests, install and instrument it instead:
pip install opentelemetry-instrumentation-httpx
from opentelemetry.instrumentation.httpx import HTTPXClientInstrumentor
HTTPXClientInstrumentor().instrument()
The OTel Collector
The OTel Collector is an optional but recommended routing layer between your service and the trace backend. Instead of sending traces directly from the application to Tempo, you send them to the Collector, which forwards them to Tempo (and can fan out to multiple backends simultaneously).
otel-collector/otel-collector.yml:
receivers:
  otlp:
    protocols:
      grpc:
        endpoint: "0.0.0.0:4317"
      http:
        endpoint: "0.0.0.0:4318"

processors:
  batch:
    timeout: 1s
    send_batch_size: 1024

exporters:
  otlp:
    endpoint: "tempo:4317"
    tls:
      insecure: true

service:
  pipelines:
    traces:
      receivers: [otlp]
      processors: [batch]
      exporters: [otlp]
The benefit: you can add exporters (e.g., a commercial tracing backend) by adding a line in the Collector config rather than redeploying the application. The Collector also handles retries, buffering, and batching more robustly than the in-process SDK.
Tempo configuration
tempo/tempo.yml:
server:
  http_listen_port: 3200

distributor:
  receivers:
    otlp:
      protocols:
        grpc:
          endpoint: "0.0.0.0:4317"

ingester:
  max_block_bytes: 1_000_000
  max_block_duration: 5m

compactor:
  compaction:
    block_retention: 24h

storage:
  trace:
    backend: local
    local:
      path: /tmp/tempo/blocks
    wal:
      path: /tmp/tempo/wal

metrics_generator:
  registry:
    external_labels:
      source: tempo
  storage:
    path: /tmp/tempo/generator/wal
    remote_write:
      - url: http://prometheus:9090/api/v1/write
        send_exemplars: true
  traces_storage:
    path: /tmp/tempo/generator/traces
  processor:
    service_graphs:
      dimensions: [service.name]
      wait: 10s
    span_metrics:
      dimensions: [service.name, span.kind]
    local_blocks:
      filter_server_spans: false
      flush_to_storage: false

overrides:
  defaults:
    metrics_generator:
      processors: [service-graphs, span-metrics, local-blocks]
      generate_native_histograms: both
The metrics_generator block enables Tempo’s built-in metrics derived from trace data. Three processors work together:
- service-graphs: builds the service topology graph by matching CLIENT and SERVER span pairs across services. Emits
traces_service_graph_request_totalandtraces_service_graph_request_duration_secondsto Prometheus. - span-metrics: emits per-span rate and latency metrics (
traces_spanmetrics_*), giving you per-operation RED metrics without separate instrumentation. - local-blocks: powers the Grafana Traces Drilldown UI and TraceQL metrics queries. Requires its own
traces_storage.pathseparate from the metrics WAL.
remote_write pushes the generated metrics into Prometheus. Prometheus v3 requires --web.enable-remote-write-receiver to accept these writes:
  prometheus:
    command:
      - --config.file=/etc/prometheus/prometheus.yml
      - --storage.tsdb.retention.time=15d
      - --web.enable-lifecycle
      - --enable-feature=exemplar-storage,otlp-write-receiver
      - --web.enable-remote-write-receiver
Docker Compose additions
  order-service:
    build: ./order-service
    ports:
      - "8001:8001"
    environment:
      SERVICE_NAME: order-service
      INVENTORY_SERVICE_URL: http://inventory-service:8002
      PAYMENT_SERVICE_URL: http://payment-service:8003
      NOTIFICATION_SERVICE_URL: http://notification-service:8004
      OTEL_EXPORTER_OTLP_ENDPOINT: http://otel-collector:4317

  inventory-service:
    build: ./inventory-service
    ports:
      - "8002:8002"
    environment:
      SERVICE_NAME: inventory-service
      OTEL_EXPORTER_OTLP_ENDPOINT: http://otel-collector:4317

  payment-service:
    build: ./payment-service
    ports:
      - "8003:8003"
    environment:
      SERVICE_NAME: payment-service
      OTEL_EXPORTER_OTLP_ENDPOINT: http://otel-collector:4317

  notification-service:
    build: ./notification-service
    ports:
      - "8004:8004"
    environment:
      SERVICE_NAME: notification-service
      OTEL_EXPORTER_OTLP_ENDPOINT: http://otel-collector:4317

  tempo:
    image: grafana/tempo:2.10.5
    restart: unless-stopped
    ports:
      - "3200:3200"
    volumes:
      - ./tempo/tempo.yml:/etc/tempo.yaml
    command: ["-config.file=/etc/tempo.yaml"]

  otel-collector:
    image: otel/opentelemetry-collector-contrib:0.150.1
    restart: unless-stopped
    volumes:
      - ./otel-collector/otel-collector.yml:/etc/otelcol-contrib/config.yaml
    ports:
      - "4317:4317"
      - "4318:4318"
Verifying traces in Grafana
Start the stack with docker compose up -d, send a few requests to order-service, then open Grafana → Explore → select the Tempo datasource.
# Small order (fast path — ~40ms total)
curl -X POST http://localhost:8001/orders \
  -H "Content-Type: application/json" \
  -d '{"item":"book","quantity":2,"price":9.99}'

# Large order (slow path — ~320ms total, most of it in inventory-service)
curl -X POST http://localhost:8001/orders \
  -H "Content-Type: application/json" \
  -d '{"item":"book","quantity":8,"price":9.99}'
Use the Search tab to find recent traces. Filter by service.name = order-service to see all traces that started at the entry point. Click any trace to open the flame graph view.
On a fast trace (quantity=2) you should see spans from all four services in one view:
order-service: root span +process_order+validate_order+check_inventory+reserve_inventory+charge_payment+send_notificationinventory-service:GET /stock/book+POST /stock/book/reserve+reserve_stock+slow_lookup(narrow)payment-service:POST /chargesnotification-service:POST /notify
On a slow trace (quantity=8) the slow_lookup span in inventory-service dominates — it should be visually the widest bar, spanning most of the total trace duration. This is the cross-service latency problem that post 10 investigates.
The Service Graph view in Tempo shows the four services as nodes with directed edges for each call relationship, annotated with request rate and error rate. It is derived automatically from trace data by the service-graphs processor.
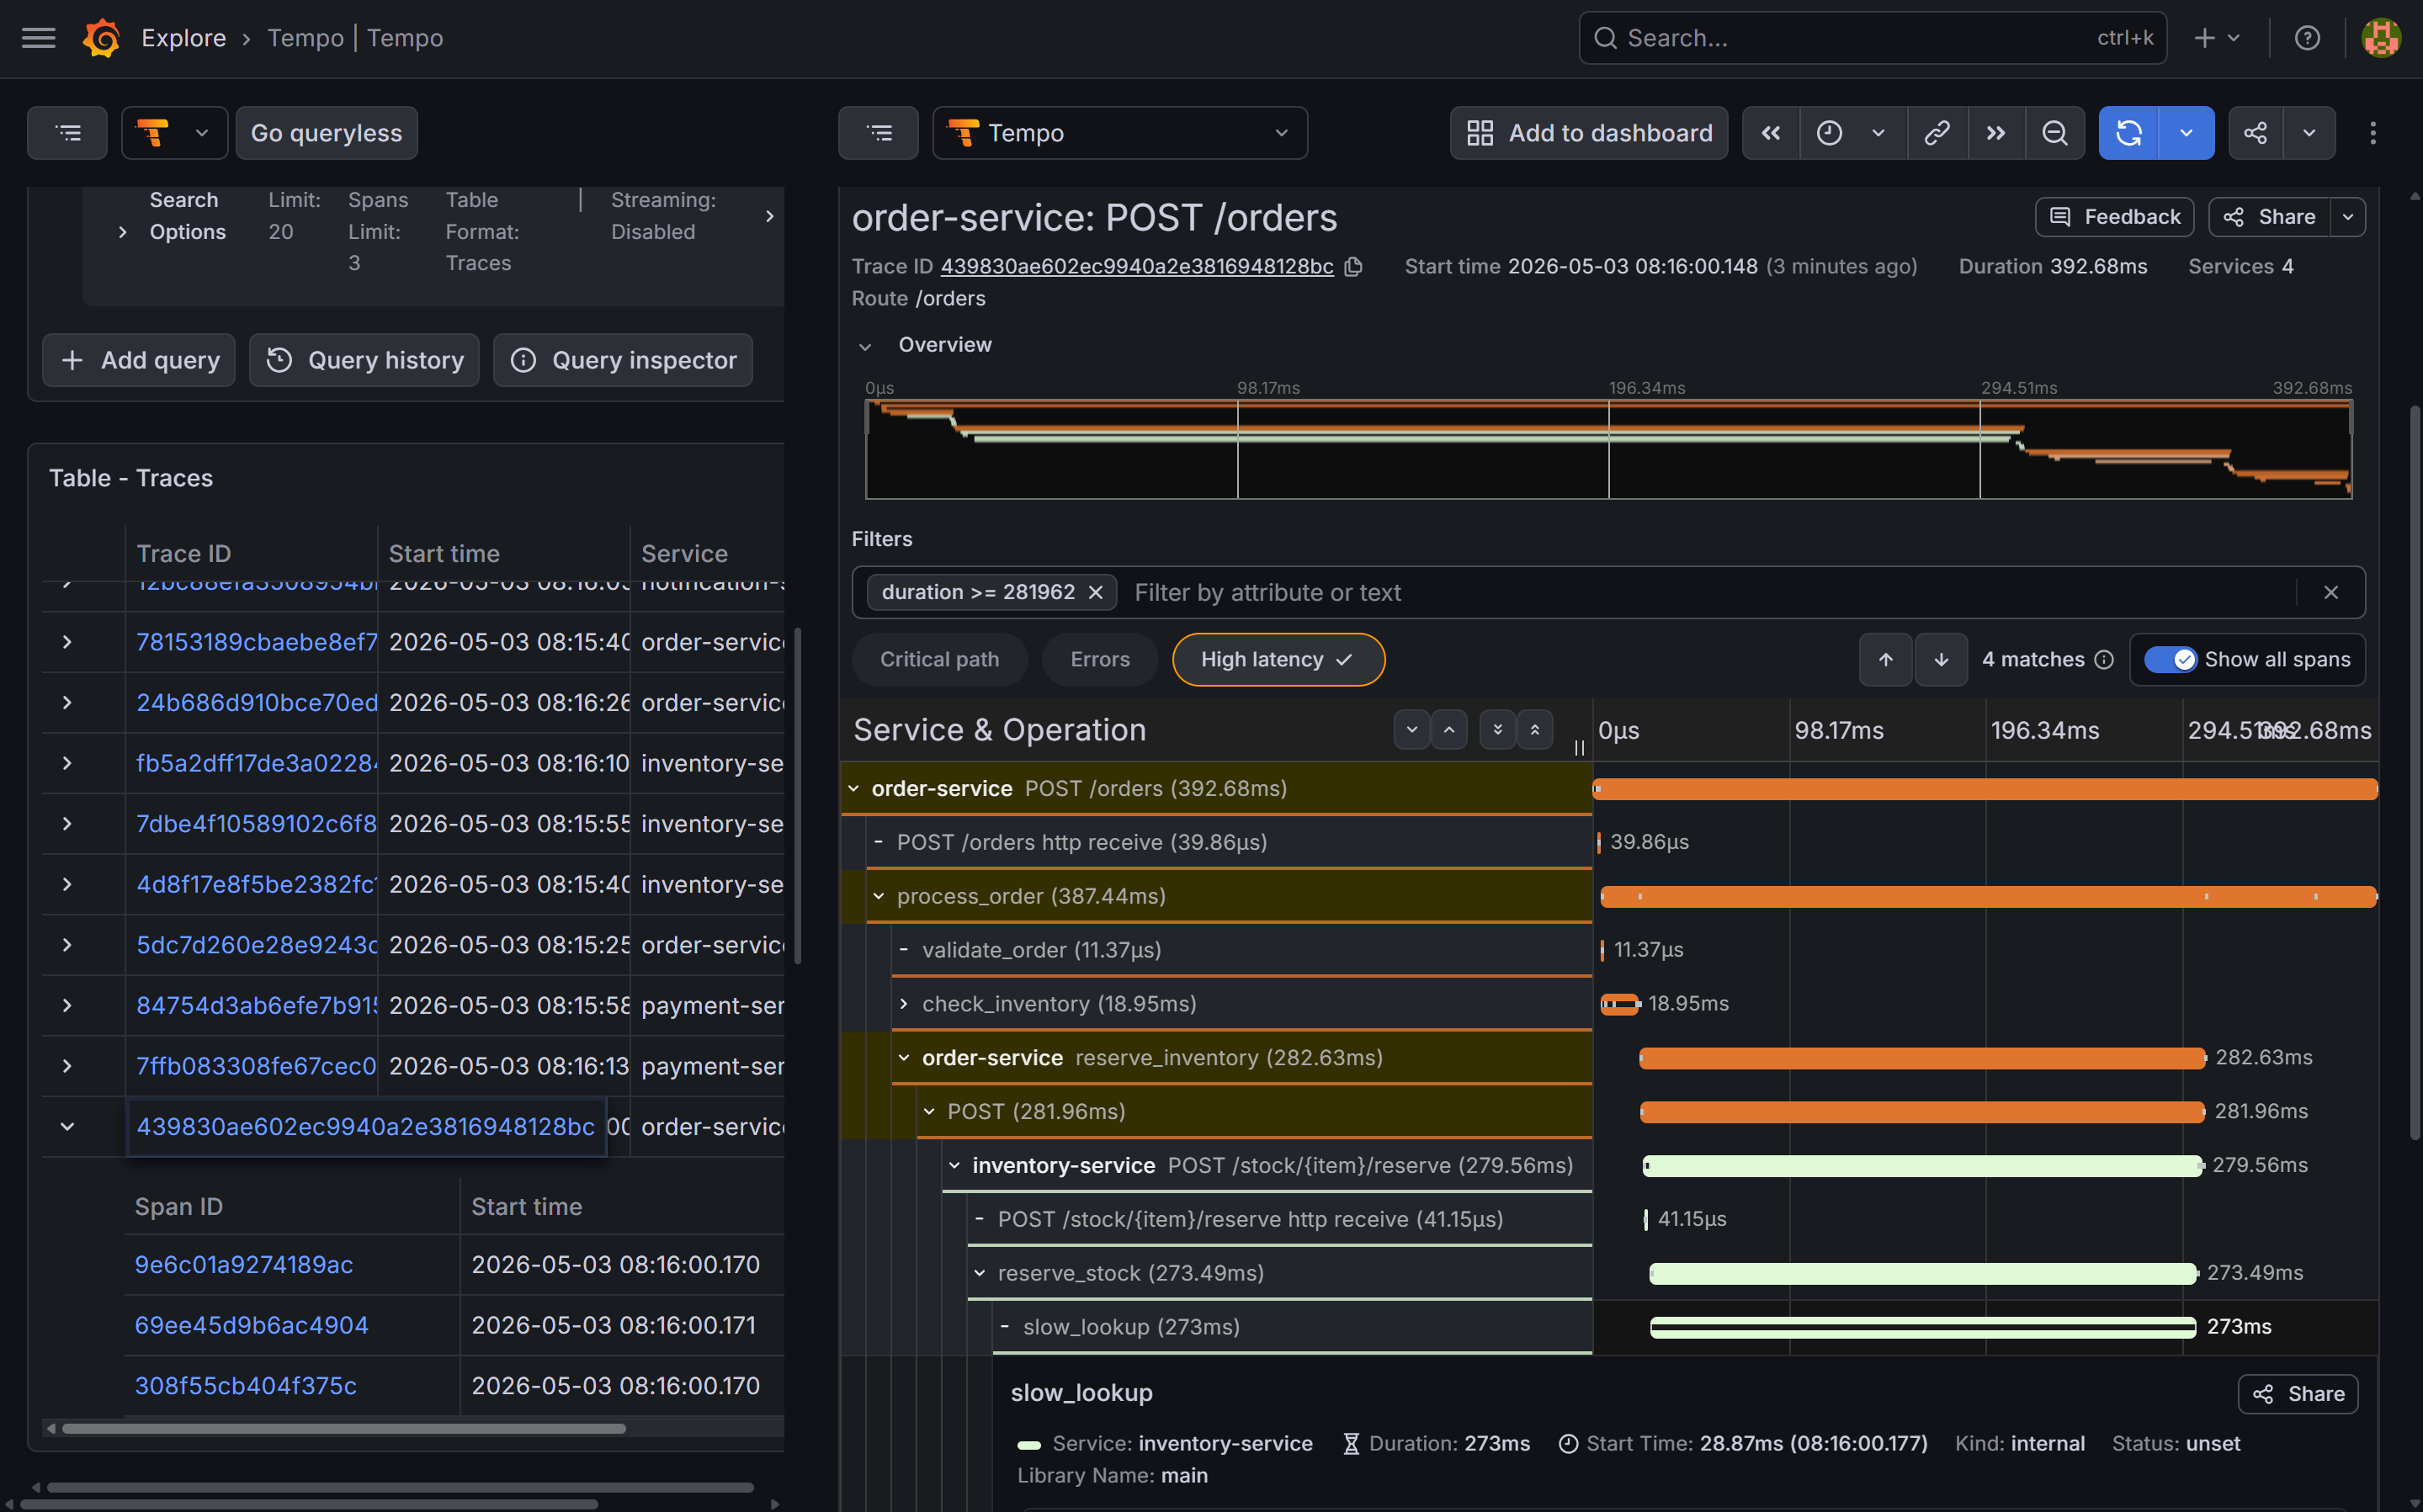
slow_lookup span inside inventory-service is the widest bar by far — 270ms out of a ~390ms total — making the bottleneck immediately obvious without reading a single log line.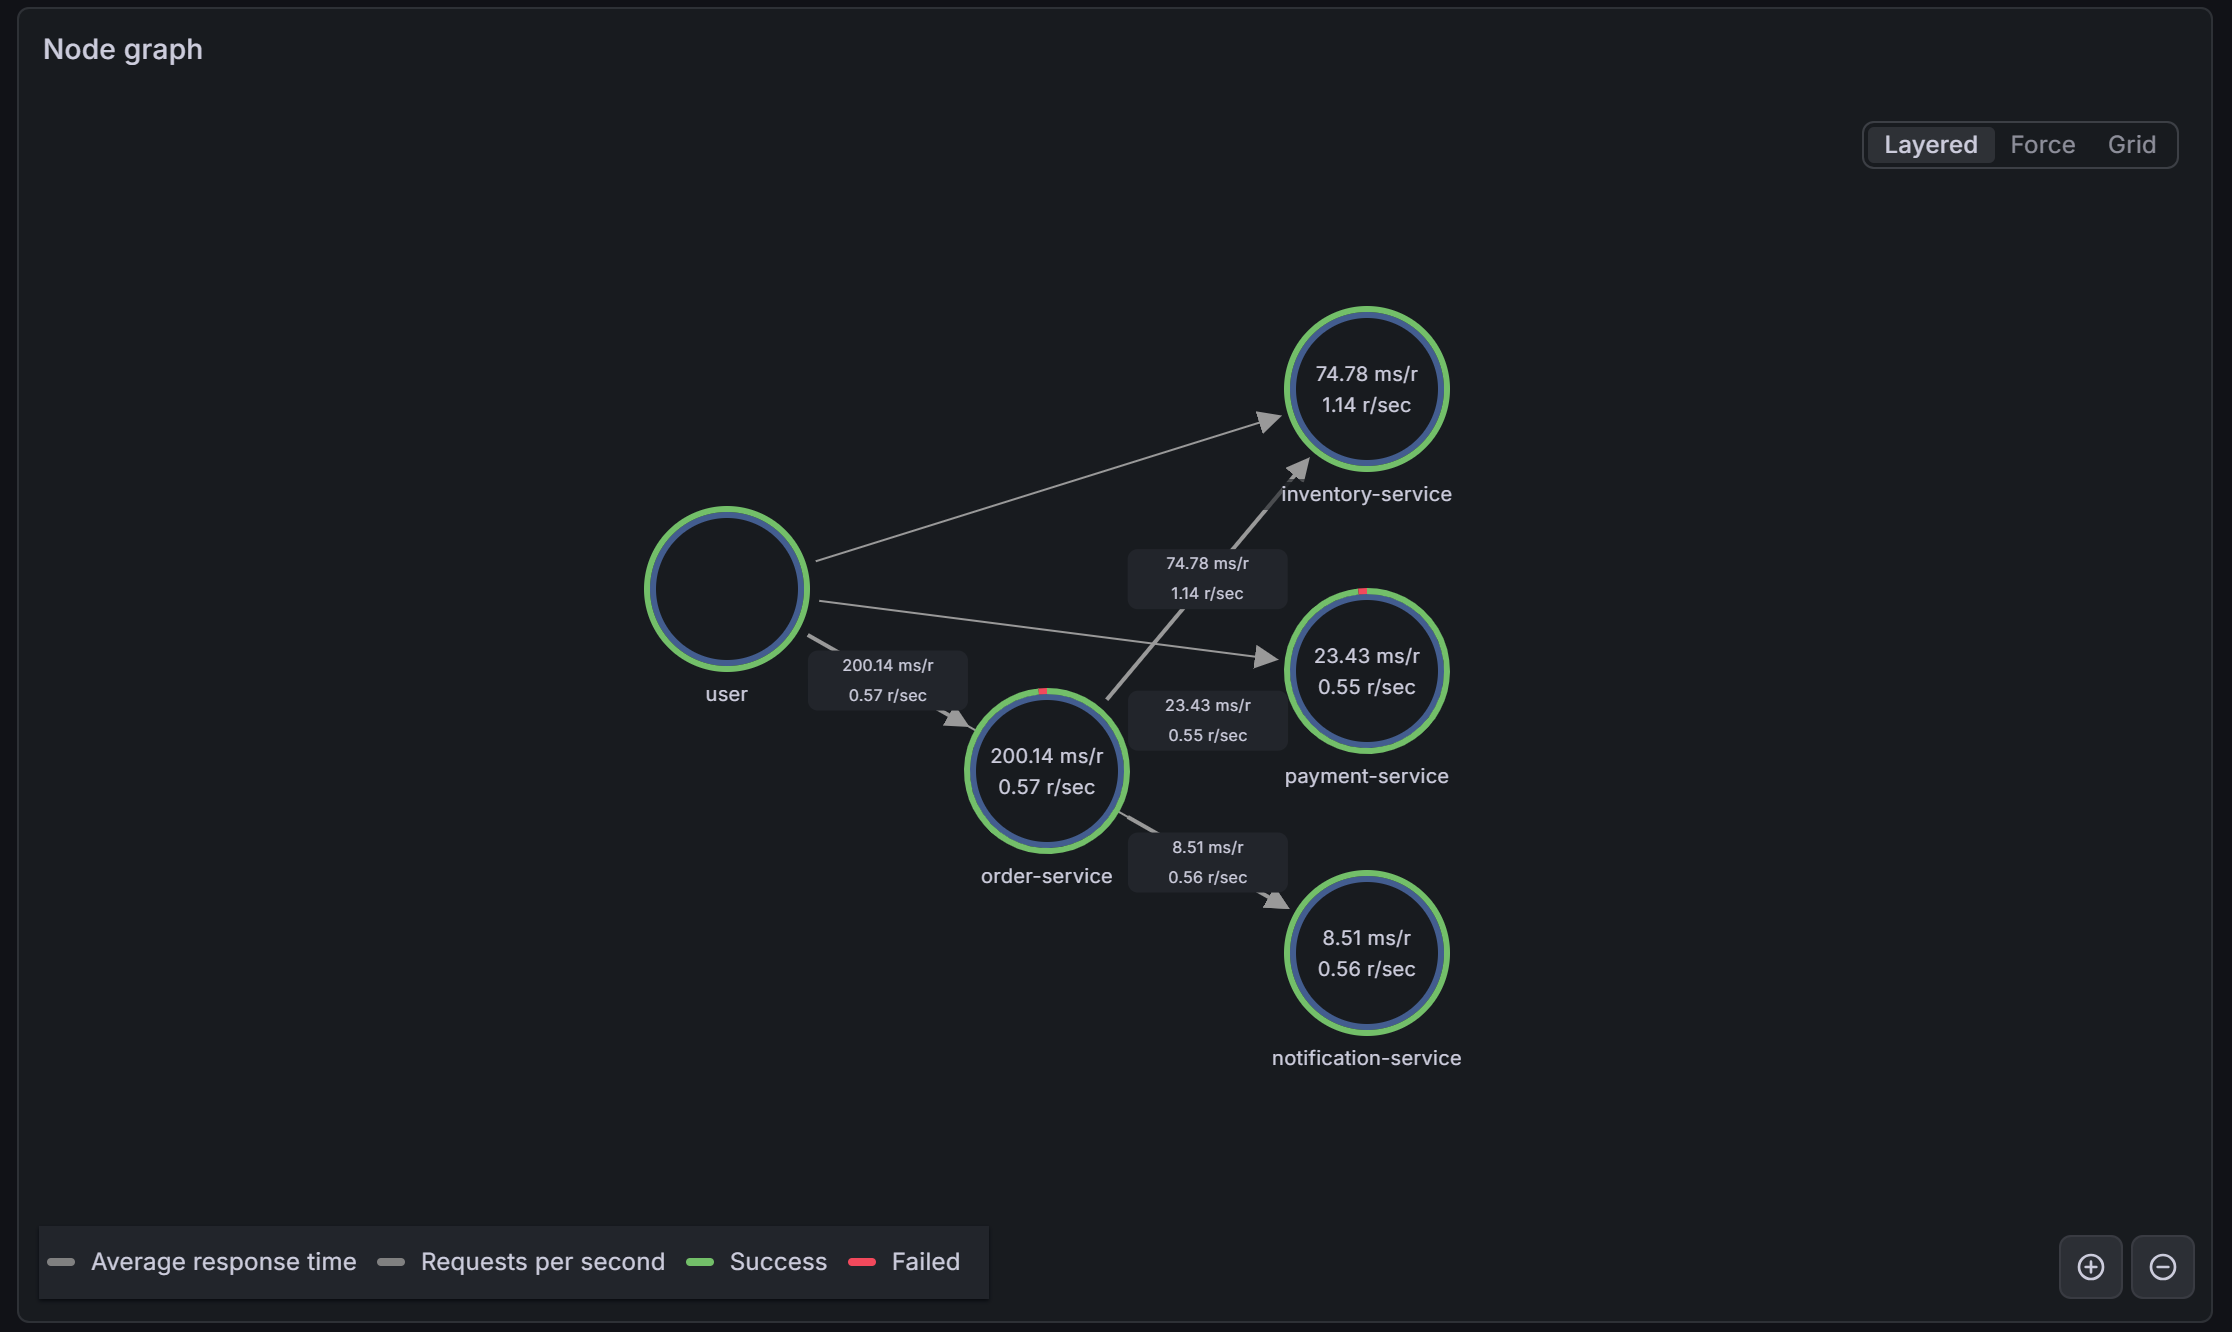
service-graphs metrics generator. Each edge shows request rate and p99 latency. The elevated latency on the order-service → inventory-service edge is already visible here before you open a single trace.What you have now
- OpenTelemetry auto-instrumentation for all FastAPI requests across all four services
- Manual spans for application-level operations with custom attributes — including the
slow_lookupspan ininventory-servicethat reveals the planted performance defect - W3C TraceContext propagation via
traceparentheaders, stitching spans from four separate processes into a single trace tree - The OTel Collector as a routing layer, receiving traces from all four services on port 4317 and forwarding to Tempo
- Tempo storing traces locally with a 24-hour retention window
- The Tempo Service Graph view showing the topology of the four-service system, built from trace data alone
- Traces visible in Grafana Explore with flame graph visualization spanning all four services in a single view
- Log lines containing
trace_idthat link to the trace in Tempo (set up in post 8), working from any of the four services
In the final post, we use all three signals together to walk through a cross-service incident: an alert fires on order-service, but the root cause lives in inventory-service.