
Alerting: Prometheus rules and Alertmanager
Contents
This is part 7 of the Production Observability series. In part 6 we defined what “healthy” means via SLOs and error budgets. Now we implement the alerts and routing infrastructure.
Alert rules
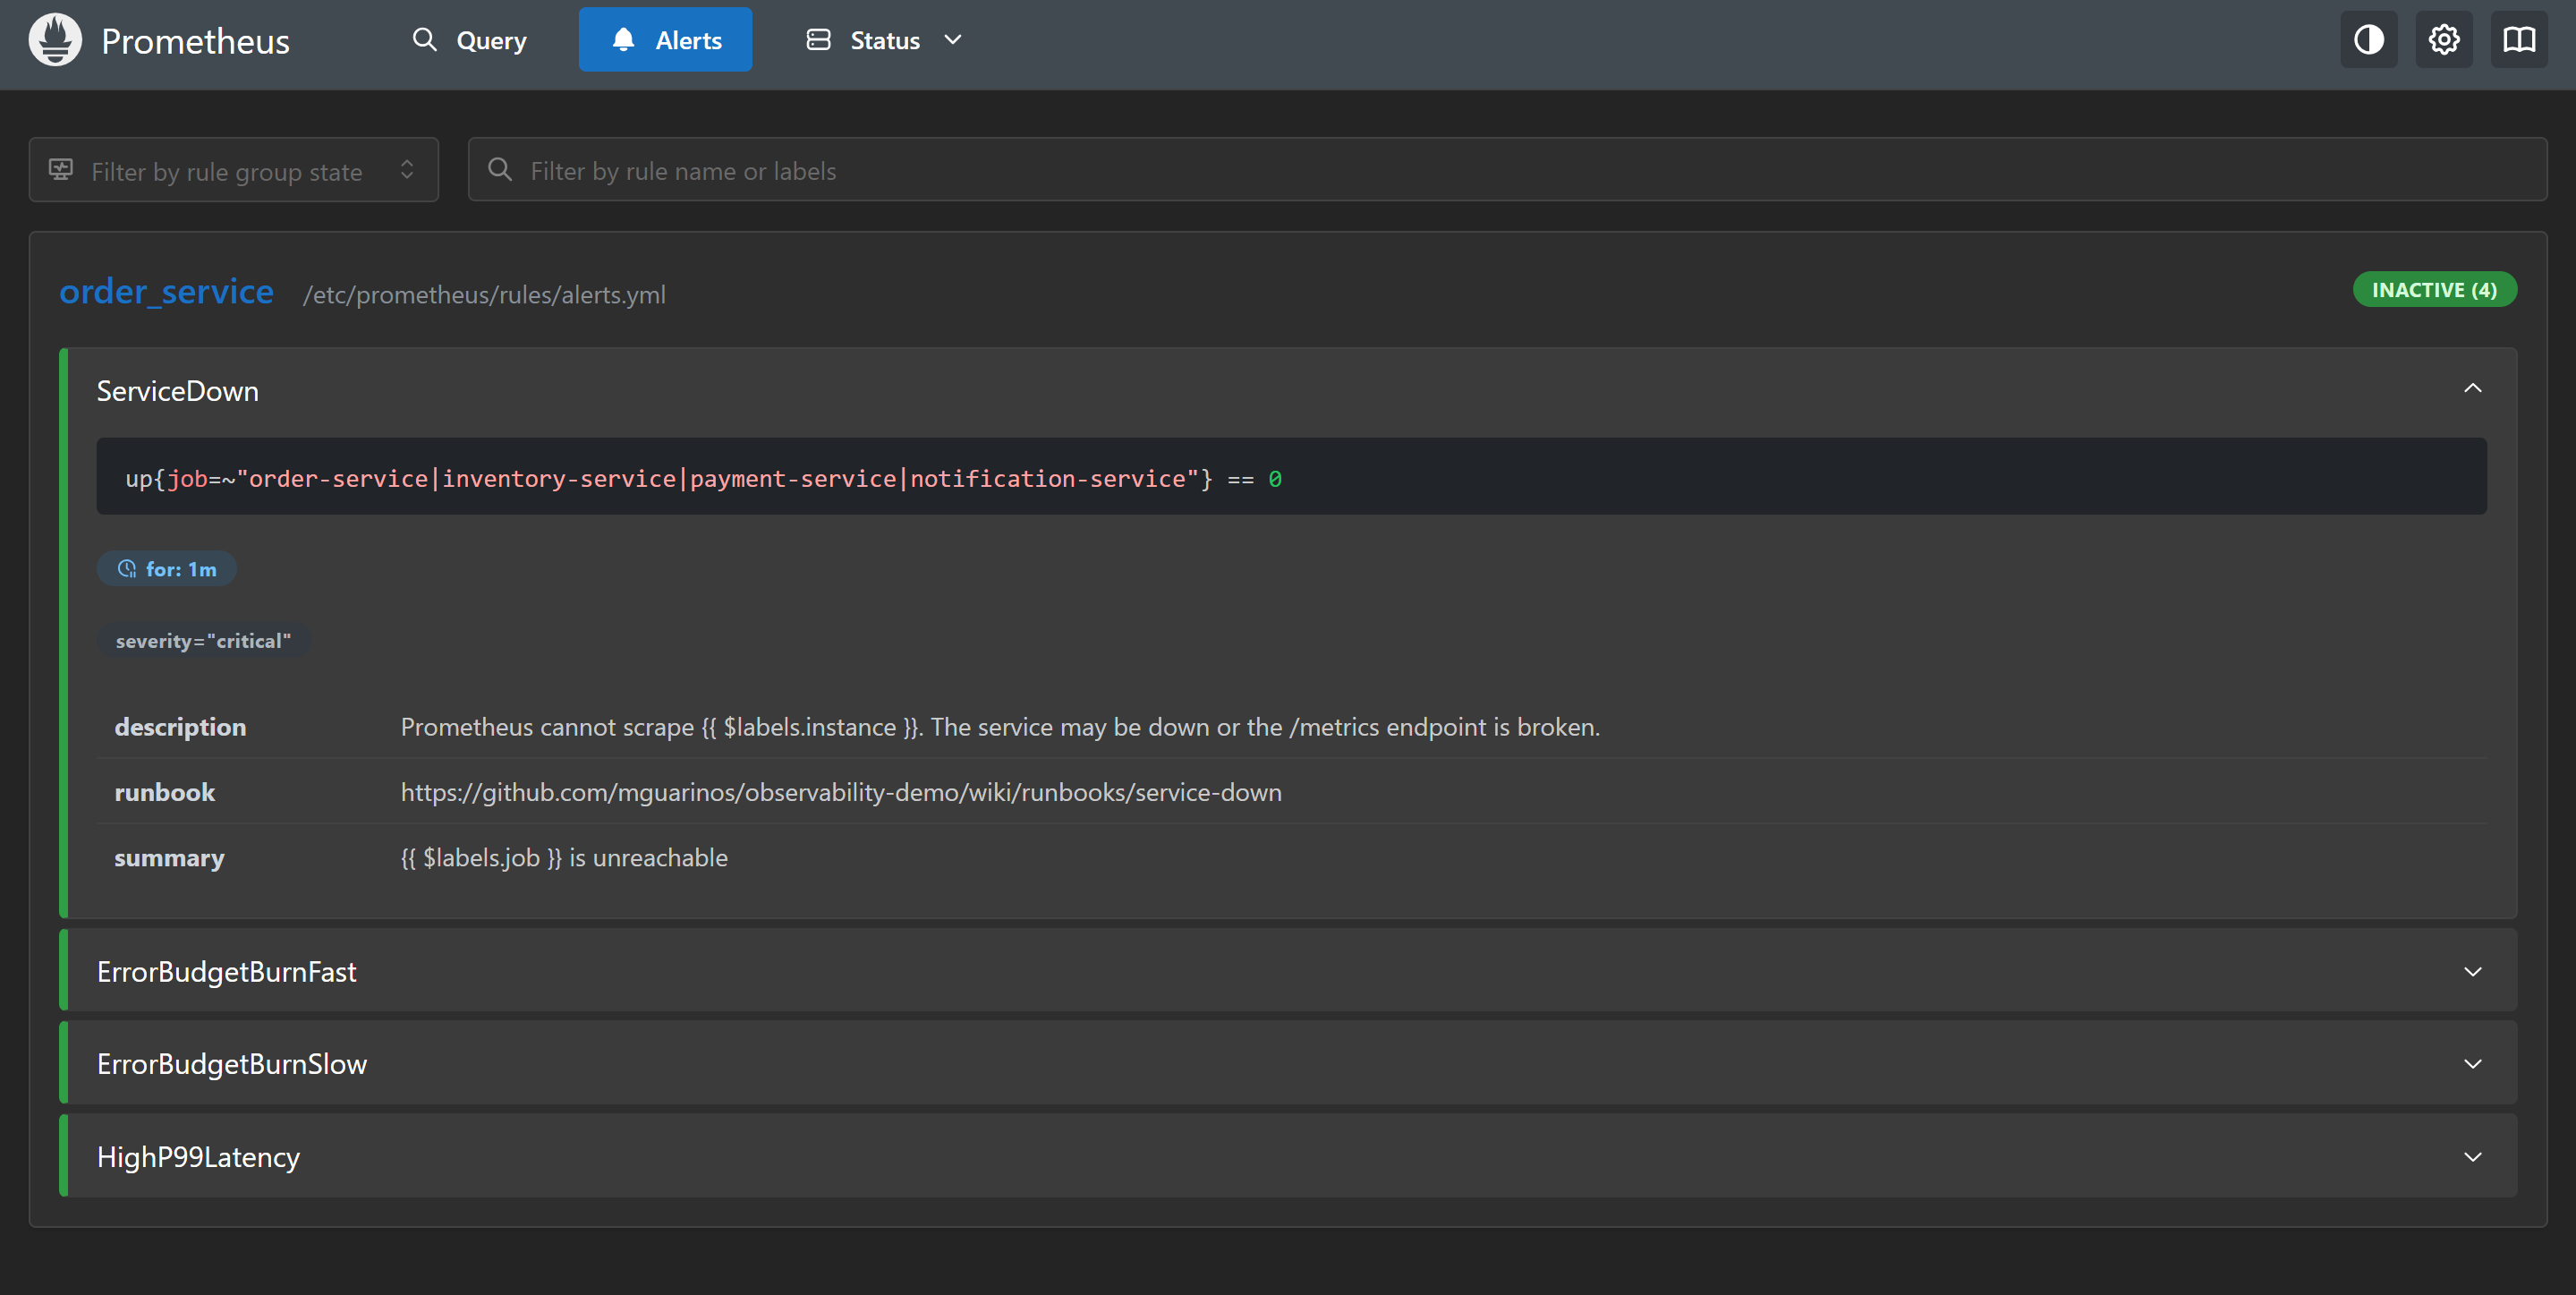
Alert rules live in YAML files under prometheus/rules/. Prometheus evaluates them on the evaluation_interval (15 seconds in our setup) and sends firing alerts to Alertmanager.
prometheus/rules/alerts.yml:
groups:
  - name: order_service
    rules:

      - alert: ServiceDown
        expr: up{job="order-service"} == 0
        for: 1m
        labels:
          severity: critical
        annotations:
          summary: "order-service is unreachable"
          description: "Prometheus cannot scrape {{ $labels.instance }}. The service may be down or the /metrics endpoint is broken."
          runbook: "https://github.com/mguarinos/observability-demo/wiki/runbooks/service-down"

      - alert: ErrorBudgetBurnFast
        expr: |
          job:slo_availability:ratio_rate5m < (1 - 14.4 * 0.001)
          and
          job:slo_availability:ratio_rate1h < (1 - 14.4 * 0.001)
        for: 2m
        labels:
          severity: critical
          slo: availability
        annotations:
          summary: "Fast error budget burn on order-service"
          description: "Availability SLI is {{ $value | humanizePercentage }}. At this rate the monthly budget is exhausted in ~2 hours."
          runbook: "https://github.com/mguarinos/observability-demo/wiki/runbooks/error-budget-burn"

      - alert: ErrorBudgetBurnMedium
        expr: |
          job:slo_availability:ratio_rate30m < (1 - 6 * 0.001)
          and
          job:slo_availability:ratio_rate6h < (1 - 6 * 0.001)
        for: 15m
        labels:
          severity: critical
          slo: availability
        annotations:
          summary: "Sustained error budget burn on order-service"
          description: "Availability SLI is {{ $value | humanizePercentage }} over 6h. Monthly budget exhausted in ~5 days at this rate."
          runbook: "https://github.com/mguarinos/observability-demo/wiki/runbooks/error-budget-burn"

      - alert: ErrorBudgetBurnSlow
        expr: |
          job:slo_availability:ratio_rate6h < (1 - 3 * 0.001)
          and
          job:slo_availability:ratio_rate3d < (1 - 3 * 0.001)
        for: 1h
        labels:
          severity: warning
          slo: availability
        annotations:
          summary: "Slow error budget burn on order-service"
          description: "Availability SLI is {{ $value | humanizePercentage }} over 3d. Monthly budget exhausted in ~10 days at this rate."
          runbook: "https://github.com/mguarinos/observability-demo/wiki/runbooks/error-budget-burn"

      - alert: ErrorBudgetAtRisk
        expr: |
          job:slo_availability:ratio_rate6h < (1 - 1 * 0.001)
          and
          job:slo_availability:ratio_rate3d < (1 - 1 * 0.001)
        for: 3h
        labels:
          severity: warning
          slo: availability
        annotations:
          summary: "Error budget at risk on order-service"
          description: "Availability SLI is {{ $value | humanizePercentage }} over 3d. Budget will exhaust by end of window at this rate."
          runbook: "https://github.com/mguarinos/observability-demo/wiki/runbooks/error-budget-burn"

      - alert: HighP99Latency
        expr: |
          histogram_quantile(0.99,
            sum(rate(http_request_duration_seconds_bucket{job="order-service"}[5m])) by (le)
          ) > 1.0
        for: 5m
        labels:
          severity: warning
        annotations:
          summary: "High p99 latency on order-service"
          description: "p99 latency is {{ $value | humanizeDuration }} (threshold: 1s)"
The for clause
The for clause specifies how long the condition must be continuously true before the alert fires. Without for, a single scrape with an elevated error rate fires the alert — including transient blips caused by deploys, brief traffic spikes, or a single slow scrape.
for: 5m
This means: the condition must be true for five consecutive evaluation cycles before the alert transitions from pending to firing. If the condition clears at any point during those five minutes, the timer resets.
A for: 0m (or no for clause) fires immediately — appropriate for ServiceDown where you want to know instantly. For latency and error rate alerts, 2m to 5m is typical. Too short = noisy; too long = slow to catch sustained issues.
Alert states in Prometheus:
| State | Meaning |
|---|---|
| Inactive | Condition is false |
| Pending | Condition is true, timer running toward for duration |
| Firing | Condition has been true for at least for duration |
docker compose stop app) and wait 60 seconds — ServiceDown will enter Pending, then Firing.Labels and annotations
Alert labels serve two purposes: routing in Alertmanager and uniquely identifying the alert. Alertmanager routes alerts by matching label sets. If two alerts have the same name but different labels (e.g., different job values), they are distinct alerts.
Alert annotations are free-form metadata attached to a firing alert. They do not affect routing — they are for humans. Use them for:
summary— one-line description for the notification titledescription— detail for the notification body, using template variablesrunbook— URL to the runbook for this alert (this is the most valuable annotation to maintain)
Template variables available in annotations:
{{ $labels.job }}           # Label value from the alert
{{ $value }}                # The value that triggered the alert
{{ $value | humanizeDuration }}  # Format as duration string
{{ $value | humanizePercentage }} # Format as percentage
Alertmanager
Alertmanager receives firing alerts from Prometheus, deduplicates them, groups them, applies routing rules, and sends notifications to configured receivers.
Add Alertmanager to docker-compose.yml:
  alertmanager:
    image: prom/alertmanager:v0.32.0
    restart: unless-stopped
    ports:
      - "9093:9093"
    volumes:
      - ./alertmanager/alertmanager.yml:/etc/alertmanager/alertmanager.yml
    command:
      - --config.file=/etc/alertmanager/alertmanager.yml
      - --storage.path=/alertmanager
    environment:
      - SLACK_WEBHOOK_URL=${SLACK_WEBHOOK_URL}
Point Prometheus at it in prometheus.yml:
alerting:
  alertmanagers:
    - static_configs:
        - targets: ["alertmanager:9093"]
Alertmanager configuration
alertmanager/alertmanager.yml:
global:
  resolve_timeout: 5m

route:
  receiver: blackhole
  group_by: [alertname, job]
  group_wait: 30s
  group_interval: 5m
  repeat_interval: 4h

  routes:
    - matchers:
        - severity="critical"
      receiver: slack-critical
      group_wait: 10s
      repeat_interval: 1h
      continue: true
    - matchers:
        - severity=~"warning|critical"
      receiver: slack-default

receivers:
  - name: blackhole

  - name: slack-default
    slack_configs:
      - api_url: "https://hooks.slack.com/services/REPLACE/WITH/REAL"
        channel: "#alerts"
        title: >-
          [{{ .Status | toUpper }}{{ if eq .Status "firing" }}:{{ .Alerts.Firing | len }}{{ end }}]
          {{ range .Alerts }}{{ .Annotations.summary }}{{ end }}
        text: >-
          {{ range .Alerts }}
          *Alert:* {{ .Annotations.summary }}
          *Description:* {{ .Annotations.description }}
          {{ if .Annotations.runbook }}*Runbook:* {{ .Annotations.runbook }}{{ end }}
          {{ end }}
        send_resolved: true

  - name: slack-critical
    slack_configs:
      - api_url: "https://hooks.slack.com/services/REPLACE/WITH/REAL"
        channel: "#incidents"
        color: danger
        title: >-
          [CRITICAL] {{ range .Alerts }}{{ .Annotations.summary }}{{ end }}
        text: >-
          {{ range .Alerts }}{{ .Annotations.description }}{{ end }}
        send_resolved: true

inhibit_rules:
  - source_matchers:
      - alertname="ServiceDown"
    target_matchers:
      - severity=~"warning|critical"
    equal: [job]
Routing tree
The routing tree is a hierarchy of rules. An incoming alert walks the tree from top to bottom. The first matching route wins, unless the route has continue: true, in which case the alert also continues matching sibling routes.
In the config above:
- Unmatched alerts go to
blackhole(the root receiver — silent, no notification) - Alerts with
severity="critical"go toslack-criticaland, because ofcontinue: true, continue to the next matching route - Alerts with
severity="warning"orseverity="critical"go toslack-default
This means a critical alert appears in both #incidents and #alerts. A warning alert appears only in #alerts. Alerts with no severity label go to blackhole. Adjust this based on your team’s workflow.
group_by controls alert grouping. Alerts with the same alertname and job values are grouped into a single notification. Without grouping, a brief network partition could produce 50 individual ServiceDown alerts for 50 services — one noisy notification per alert. With grouping, they collapse into one.
group_wait is how long Alertmanager waits to collect more alerts before sending the first notification for a new group. group_interval is how long to wait before sending updates to an already-notified group. repeat_interval is how long to wait before re-sending if the alert is still firing.
Inhibition rules
The inhibit_rules section suppresses certain alerts when others are firing.
inhibit_rules:
  - source_matchers:
      - alertname="ServiceDown"
    target_matchers:
      - severity=~"warning|critical"
    equal: [job]
When ServiceDown is firing for job="order-service", all other warning and critical alerts for the same job are suppressed. This prevents a cascade: if the service is down, its error rate and latency are meaningless and would just generate noise. The service-down alert is the single relevant signal.
Silences
Silences suppress alerts temporarily without changing alert rules. Use them during planned maintenance windows.
Create a silence via the Alertmanager UI (http://localhost:9093) or via the API:
curl -X POST http://localhost:9093/api/v2/silences \
  -H "Content-Type: application/json" \
  -d '{
    "matchers": [{"name": "job", "value": "order-service", "isRegex": false}],
    "startsAt": "2026-05-02T22:00:00Z",
    "endsAt": "2026-05-02T23:00:00Z",
    "comment": "Planned maintenance window for order-service",
    "createdBy": "mguarinos"
  }'
Silences match by label matchers. All alerts matching job="order-service" are suppressed during the window, regardless of alert name.
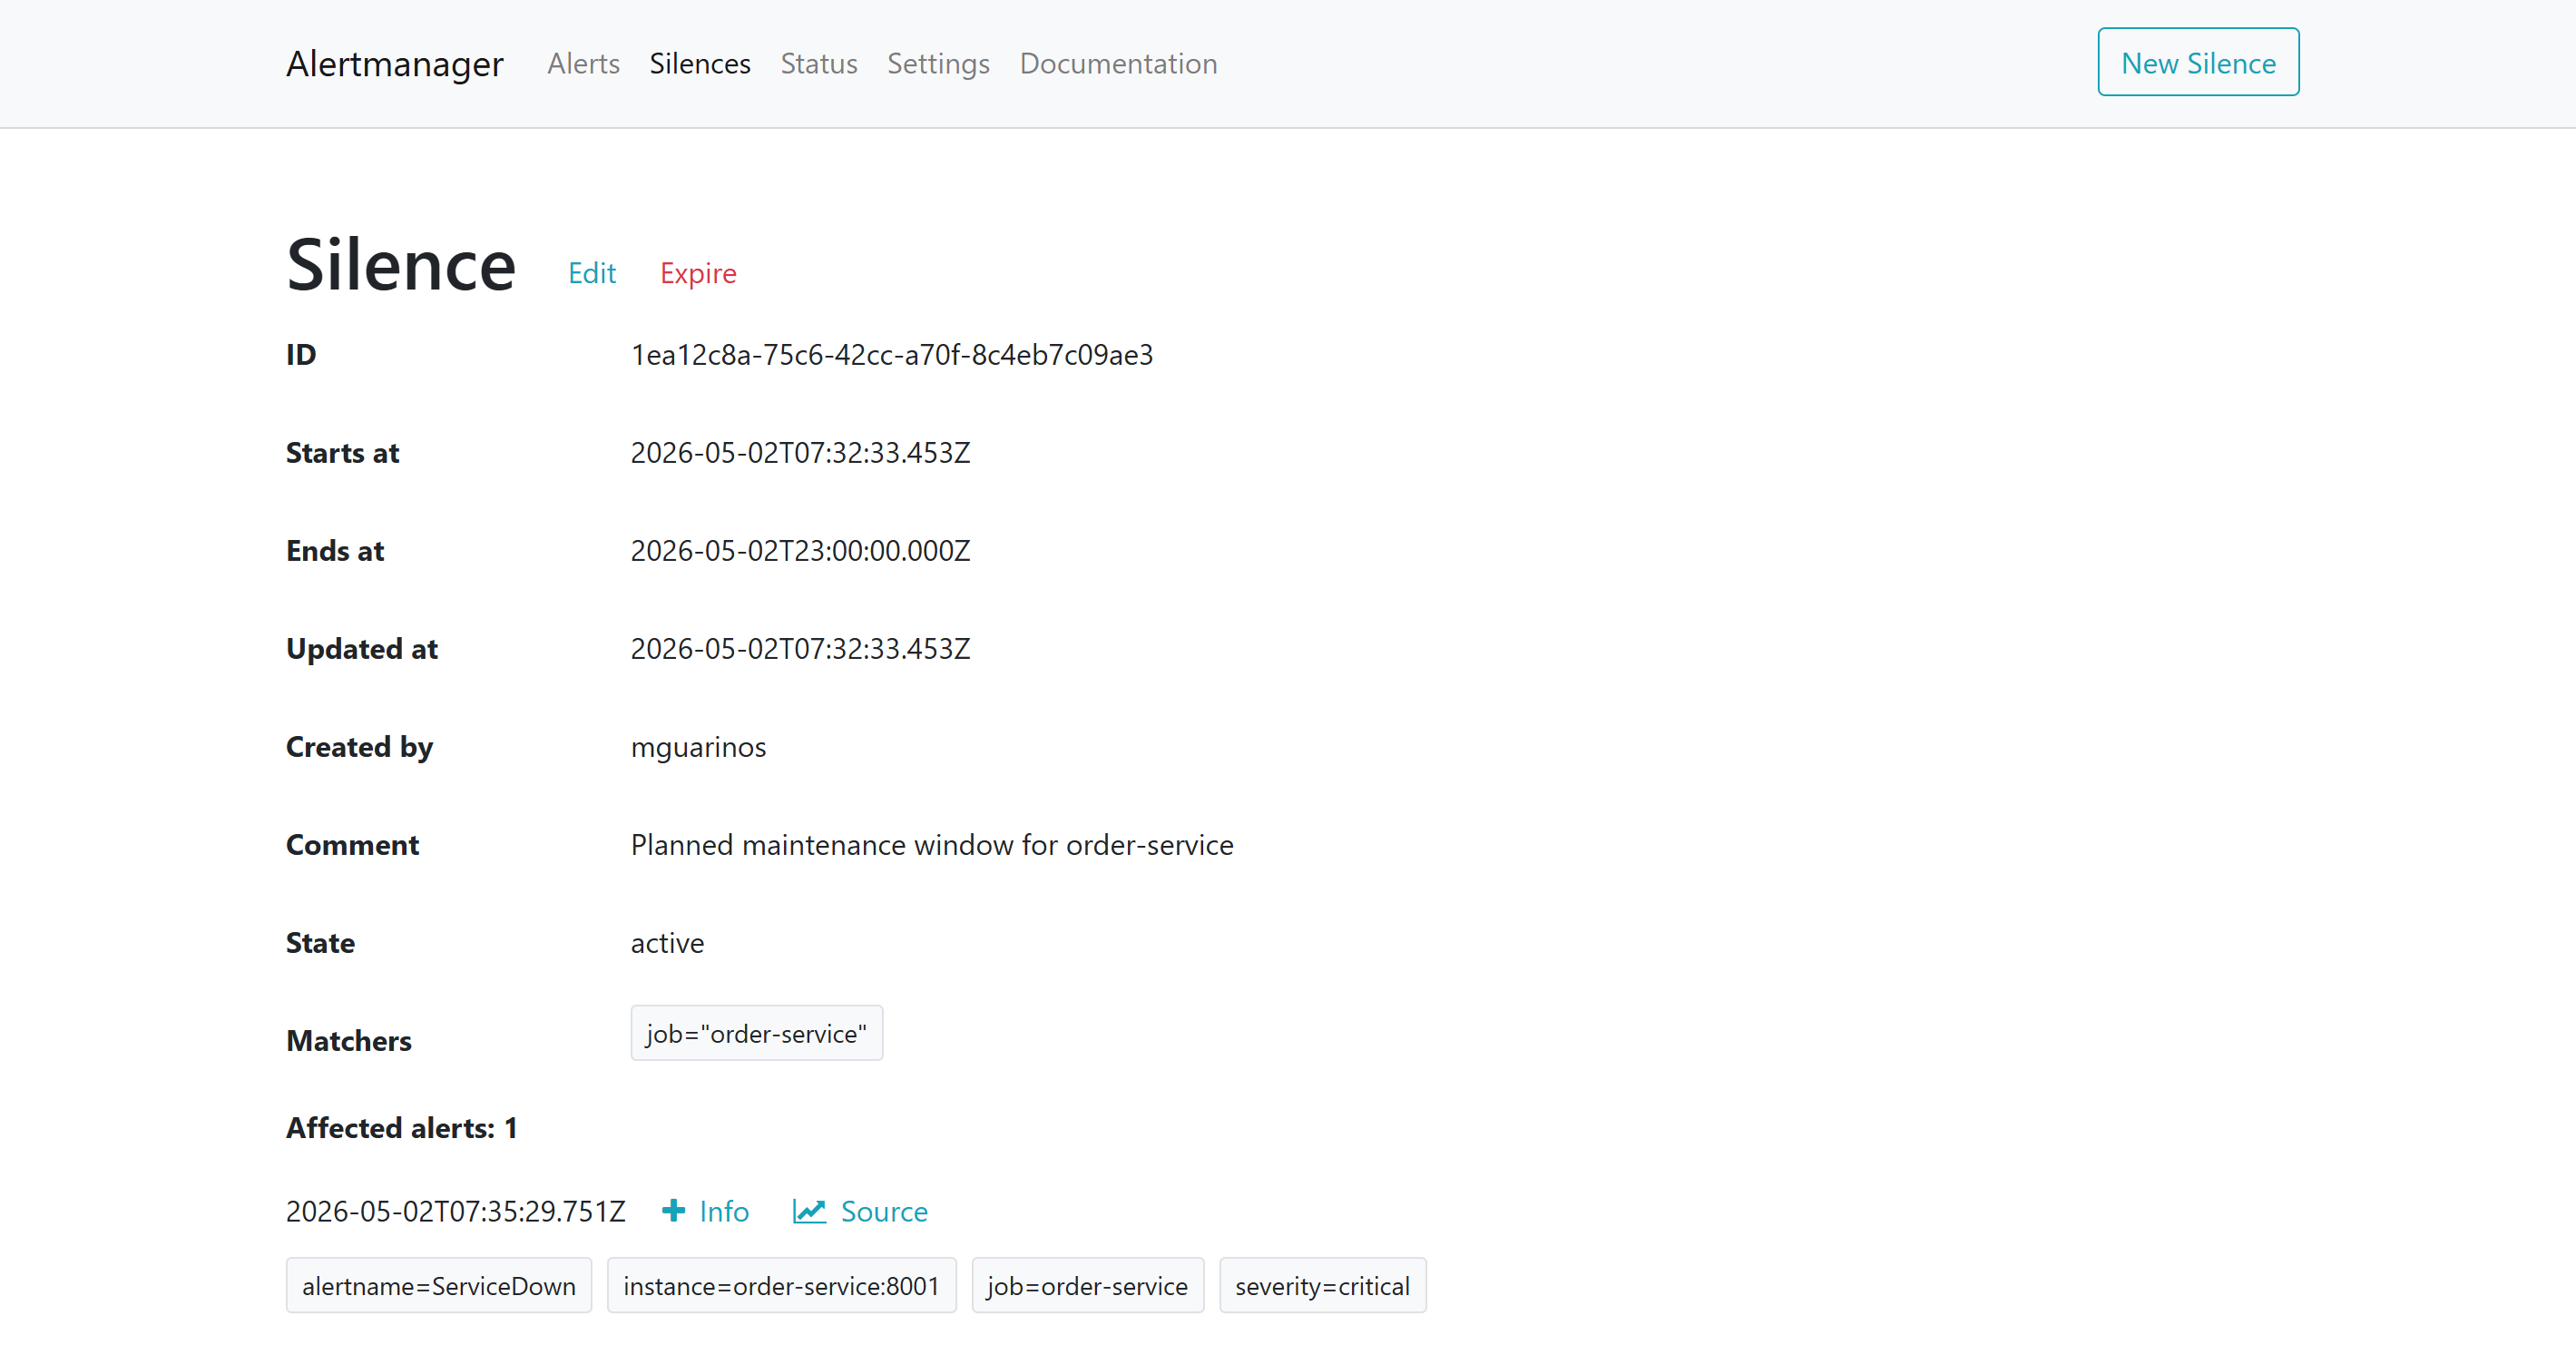
http://localhost:9093. The Alerts tab shows what Alertmanager has received from Prometheus; the Silences tab shows active suppressions. An alert can be firing in Prometheus but fully suppressed here — the silence is what stops the notification.What you have now
- Alert rules for service availability, error budget burn (fast and slow), and high p99 latency
- The
forclause preventing false positives from transient blips - Alertmanager routing critical alerts to
#incidentsand all alerts to#alerts - Alert grouping to prevent notification floods
- Inhibition rules suppressing noise when the service itself is down
- Runbook links in annotations so on-call engineers know where to start
In the next post we add the second pillar: log aggregation with Loki, structured logging from Python, and LogQL queries that bridge the gap between a firing alert and the log lines that explain it.