
Grafana: dashboards as code, not clicks
Contents
This is part 5 of the Production Observability series. We have PromQL queries from part 4. Now we put them in Grafana — but not by clicking through the UI. We provision everything from YAML and JSON files, so the setup is version-controlled and reproducible.
Why provision from files
Grafana’s UI is convenient for exploration. It is a poor foundation for a production setup.
When you configure datasources and build dashboards through the UI, the configuration lives in Grafana’s internal SQLite database. There is no version history, no code review, and no way to recreate the setup from scratch. When the container is replaced, everything is gone.
Grafana supports provisioning — loading datasources and dashboards from files at startup. The datasource configuration in provisioning/datasources/datasources.yml is read on start and applied automatically. Dashboard JSON files in a watched directory are imported without any manual steps.
Docker Compose addition
Add Grafana to docker-compose.yml:
  grafana:
    image: grafana/grafana:13.0.1
    restart: unless-stopped
    ports:
      - "3000:3000"
    environment:
      - GF_SECURITY_ADMIN_USER=admin
      - GF_SECURITY_ADMIN_PASSWORD=admin
      - GF_USERS_ALLOW_SIGN_UP=false
    volumes:
      - ./grafana/provisioning:/etc/grafana/provisioning
      - ./grafana/dashboards:/var/lib/grafana/dashboards
      - grafana-data:/var/lib/grafana
The grafana-data volume persists Grafana’s internal state (user sessions, plugin data) across container restarts, while the provisioned configuration comes from mounted files.
Datasource provisioning
grafana/provisioning/datasources/datasources.yml:
apiVersion: 1

datasources:
  - name: Prometheus
    type: prometheus
    uid: prometheus
    access: proxy
    url: http://prometheus:9090
    isDefault: true
    jsonData:
      timeInterval: 15s
      exemplarTraceIdDestinations:
        - name: traceID
          datasourceUid: tempo

  - name: Loki
    type: loki
    uid: loki
    access: proxy
    url: http://loki:3100
    jsonData:
      derivedFields:
        - matcherRegex: '"trace_id": "([a-f0-9]+)"'
          name: TraceID
          url: "$${__value.raw}"
          datasourceUid: tempo

  - name: Tempo
    type: tempo
    uid: tempo
    access: proxy
    url: http://tempo:3200
    jsonData:
      nodeGraph:
        enabled: true
      serviceMap:
        datasourceUid: prometheus
      tracesToLogs:
        datasourceUid: loki
        filterByTraceID: true
        filterBySpanID: false
        spanStartTimeShift: "-1m"
        spanEndTimeShift: "1m"
        tags:
          - key: service.name
            value: service_name
      tracesToMetrics:
        datasourceUid: prometheus
        tags:
          - key: service.name
            value: job
      search:
        hide: false
      lokiSearch:
        datasourceUid: loki
The uid field is the stable identifier used when one datasource references another — the exemplarTraceIdDestinations in Prometheus points to the Tempo datasource by uid: tempo, and the derivedFields in Loki do the same. Without UIDs, these cross-datasource links break if you rename a datasource.
The Tempo jsonData block wires up all the cross-signal navigation that makes Grafana useful as an investigation tool:
serviceMap.datasourceUid— tells Grafana where to find the service graph metrics (generated by Tempo’sservice-graphsprocessor and pushed to Prometheus via remote write).tracesToLogs— when viewing a trace span, adds a “Logs” button that runs a Loki query filtered to that trace ID and service, jumping you directly to the logs for that request.tracesToMetrics— when viewing a trace span, adds a “Metrics” button that opens the Prometheus dashboard for the relevant service.nodeGraph.enabled— enables the node graph panel in trace views, showing the service call graph inline.
We are adding Loki and Tempo datasources now even though those services come in posts 8 and 9. Grafana handles missing backends gracefully — the datasource shows as unavailable rather than erroring out the entire provisioning step.
Dashboard provisioning
grafana/provisioning/dashboards/dashboards.yml:
apiVersion: 1

providers:
  - name: default
    type: file
    disableDeletion: false
    updateIntervalSeconds: 30
    options:
      path: /var/lib/grafana/dashboards
      foldersFromFilesStructure: true
This tells Grafana to watch /var/lib/grafana/dashboards (mapped from ./grafana/dashboards on the host) and import any JSON files it finds. The updateIntervalSeconds: 30 means changes to dashboard files are picked up without restarting Grafana.
Building the service dashboard
Grafana dashboards are JSON. Rather than explaining the entire schema, let us walk through the key building blocks that appear in the service dashboard.
Variables
Variables make dashboards dynamic. Define them in the dashboard’s templating.list array:
{
  "name": "job",
  "type": "query",
  "datasource": {"type": "prometheus", "uid": "prometheus"},
  "query": "label_values(http_requests_total, job)",
  "refresh": 2,
  "includeAll": false
}
This creates a $job dropdown populated from the job label values in http_requests_total. Add it to queries as {job="$job"} and the dashboard filters by the selected service automatically.
Request rate panel
A time series panel showing requests per second:
{
  "type": "timeseries",
  "title": "Request Rate",
  "targets": [
    {
      "expr": "sum(rate(http_requests_total{job=\"$job\"}[5m])) by (endpoint)",
      "legendFormat": ""
    }
  ],
  "fieldConfig": {
    "defaults": {
      "unit": "reqps",
      "custom": {"lineWidth": 2}
    }
  }
}
Latency panel
p50, p95, p99 on one panel:
{
  "type": "timeseries",
  "title": "Request Latency",
  "targets": [
    {
      "expr": "histogram_quantile(0.50, sum(rate(http_request_duration_seconds_bucket{job=\"$job\"}[5m])) by (le))",
      "legendFormat": "p50"
    },
    {
      "expr": "histogram_quantile(0.95, sum(rate(http_request_duration_seconds_bucket{job=\"$job\"}[5m])) by (le))",
      "legendFormat": "p95"
    },
    {
      "expr": "histogram_quantile(0.99, sum(rate(http_request_duration_seconds_bucket{job=\"$job\"}[5m])) by (le))",
      "legendFormat": "p99"
    }
  ],
  "fieldConfig": {
    "defaults": {"unit": "s"}
  }
}
Error rate panel
A stat panel showing current error fraction:
{
  "type": "stat",
  "title": "Error Rate",
  "targets": [
    {
      "expr": "sum(rate(http_requests_total{job=\"$job\",status=~\"5..\"}[5m])) / sum(rate(http_requests_total{job=\"$job\"}[5m]))",
      "legendFormat": "Error Rate"
    }
  ],
  "fieldConfig": {
    "defaults": {
      "unit": "percentunit",
      "thresholds": {
        "steps": [
          {"color": "green", "value": null},
          {"color": "yellow", "value": 0.01},
          {"color": "red", "value": 0.05}
        ]
      }
    }
  }
}
The colour thresholds here implement a visual SLO: green below 1% error rate, yellow between 1–5%, red above 5%.
The complete dashboard JSON
The full grafana/dashboards/service.json is in the repository. It includes:
- A
$jobvariable to switch between services - Four stat panels: request rate, error rate, p99 latency, orders in flight
- A time series panel: request rate by endpoint
- A time series panel: p50/p95/p99 latency
- A time series panel: error rate over time with threshold band
- A time series panel: orders created vs failed per minute
To add it: place the JSON file in grafana/dashboards/ and Grafana imports it within 30 seconds. No clicking required.
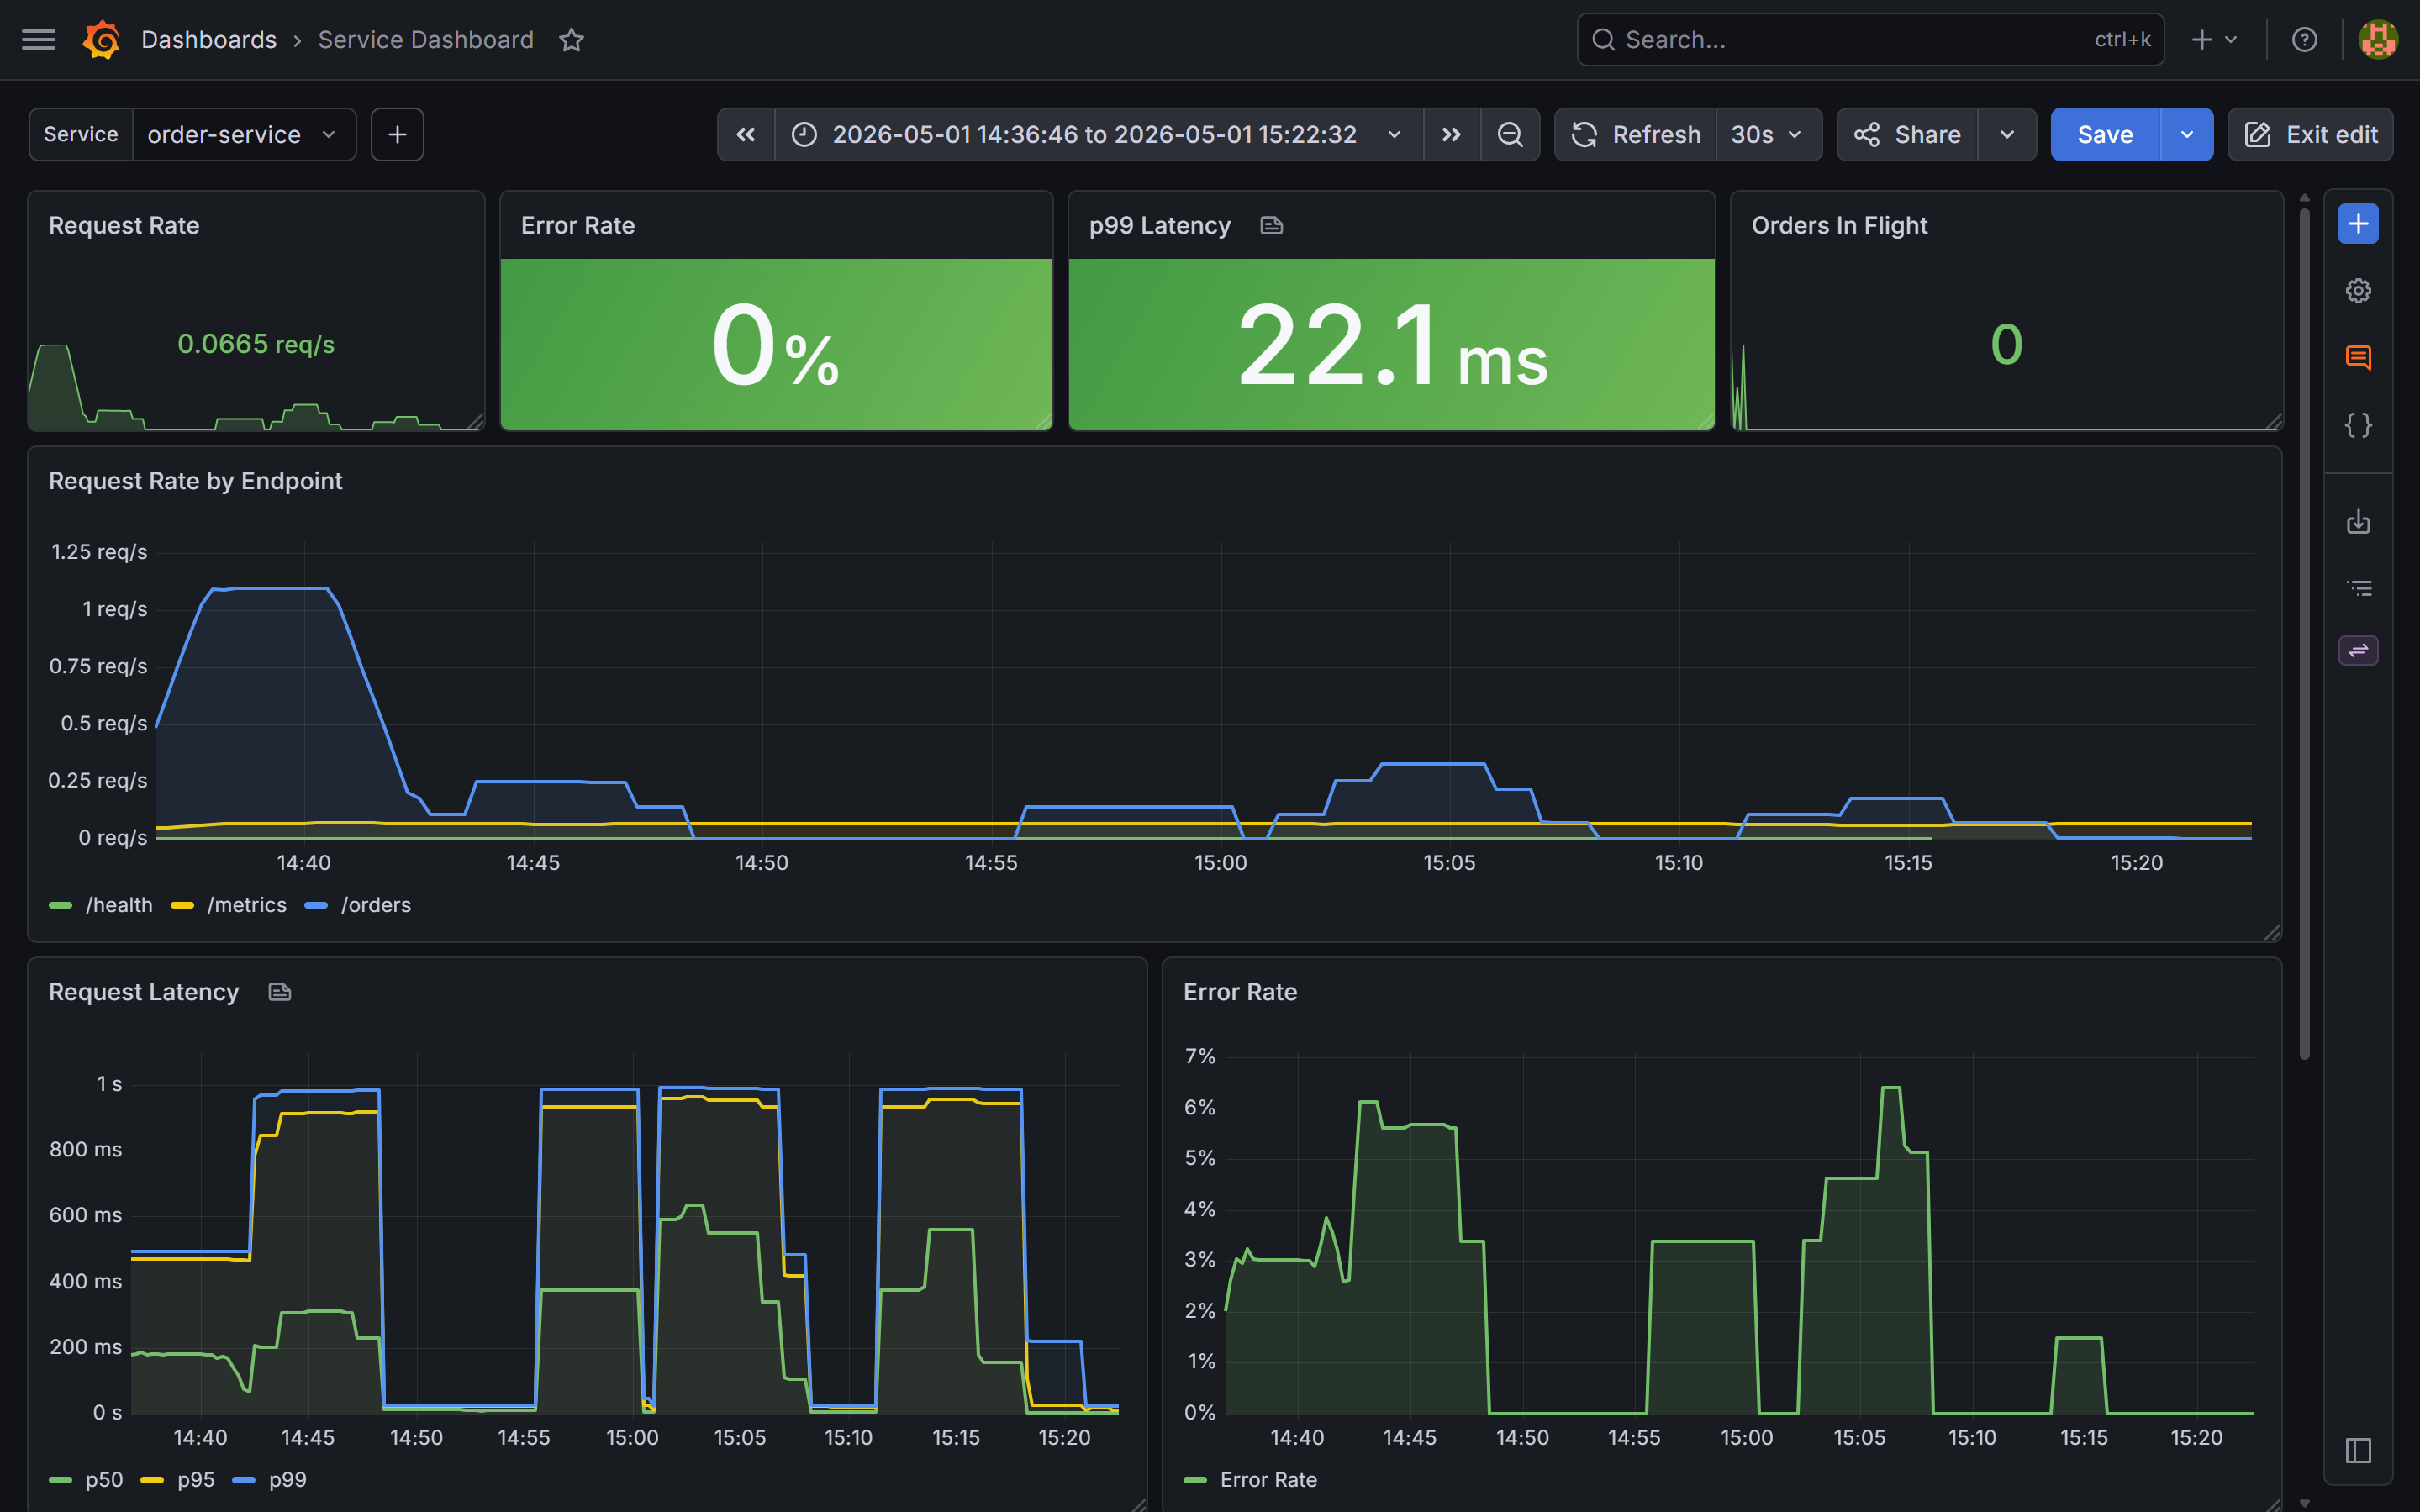
$job dropdown filters all panels to a single service.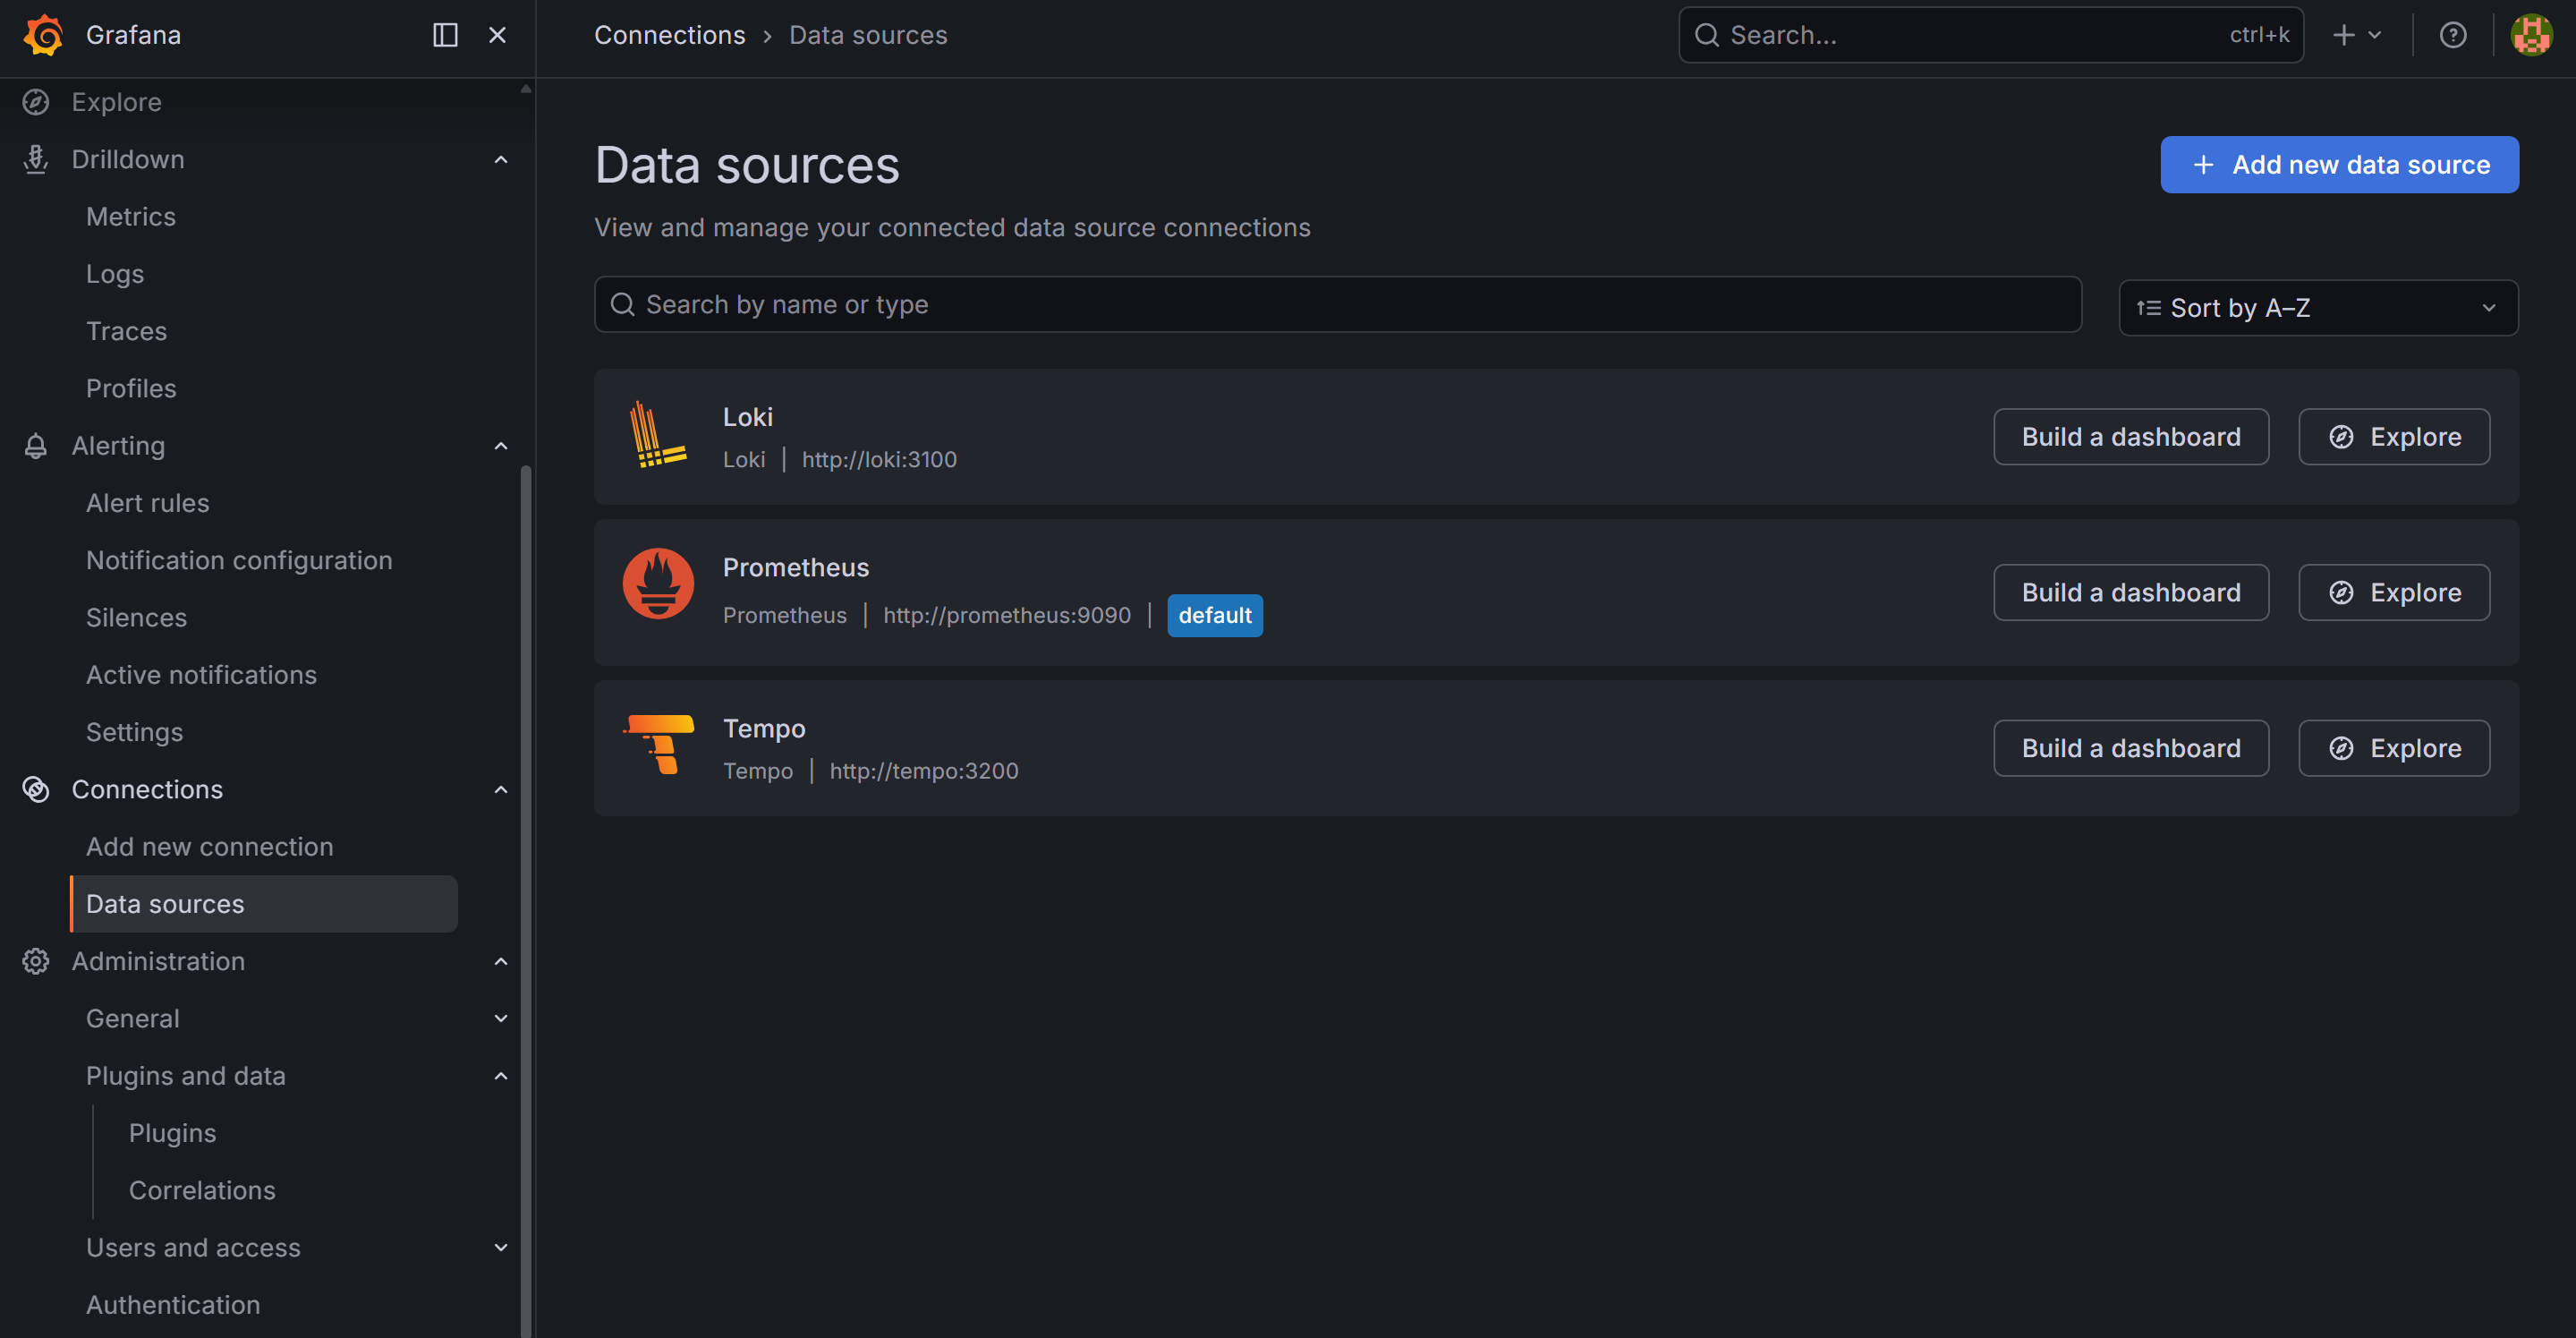
Iterating on dashboards
The common workflow:
- Build or modify a dashboard in the Grafana UI
- Go to Dashboard settings → JSON Model → copy the JSON
- Save it to
grafana/dashboards/in the repository - Commit and push
On the next docker compose up, the dashboard is provisioned automatically. Anyone who clones the repository gets the same dashboards without any manual setup.
One practical note: when a dashboard is provisioned from a file, Grafana marks it as “read only” in the UI — you cannot save changes back via the UI. You can still explore it, modify it temporarily, and copy the JSON from the JSON Model view. This is intentional: the file is the source of truth.
What you have now
- Grafana running with all three datasources provisioned from YAML — Prometheus, Loki (coming in post 8), Tempo (coming in post 9)
- A service dashboard loaded from JSON, filterable by
$job - Rate, error, and latency panels using the PromQL patterns from post 4
In the next post we define SLOs for the order service and build the error budget view that turns these metrics into actionable reliability targets.