
Loki: log aggregation without the Elasticsearch overhead
Contents
This is part 8 of the Production Observability series. We have metrics and dashboards from posts 2–7. Now we add logs: structured output from the application, shipped to Loki, queryable in Grafana.
Why Loki, not Elasticsearch
Elasticsearch (the ELK stack) is the traditional log aggregation choice. It indexes every log field, which makes full-text search fast and flexible. It also makes Elasticsearch expensive to run: it stores a full inverted index of every log line, consuming significant memory and disk.
Loki takes a different approach, inspired by Prometheus. It does not index log content at all. Instead, it indexes only log metadata — labels — and stores the log lines compressed in object storage (or a local filesystem). To retrieve logs, you filter by label first, then search through the lines in the matching streams.
This makes Loki much cheaper to operate than Elasticsearch for typical log query patterns — most queries start with “show me logs from service X” or “show me error logs from the last 30 minutes”, which are label filters. The trade-off: arbitrary full-text search without a known label is slower.
For teams already running Prometheus, Loki fits naturally. The label model is the same, and Grafana queries both from the same interface.
Structured logging in Python
Unstructured logs are hard to query:
2026-05-01 14:32:01 ERROR failed to process order abc-123: database timeout
To find this log in Loki, you would need to search for the string “database timeout” through every line in the stream. That is slow. There is also no reliable way to extract order_id=abc-123 without a regex that breaks if the message format changes.
Structured logs emit JSON:
{
  "timestamp": "2026-05-01T14:32:01Z",
  "level": "error",
  "event": "order_processing_failed",
  "order_id": "abc-123",
  "error": "database timeout"
}
Every field is now a first-class value. You can filter by level="error", by order_id="abc-123", or extract metrics from numeric fields. The format is consistent — no regex required.
structlog
structlog is the standard choice for structured logging in Python. Install it:
pip install structlog
app/logger.py:
import sys
import logging
import structlog

logging.basicConfig(
    format="%(message)s",
    stream=sys.stdout,
    level=logging.INFO,
)

structlog.configure(
    processors=[
        structlog.contextvars.merge_contextvars,
        structlog.processors.add_log_level,
        structlog.processors.TimeStamper(fmt="iso"),
        structlog.processors.JSONRenderer(),
    ],
    logger_factory=structlog.PrintLoggerFactory(),
)

def get_logger(name: str):
    return structlog.get_logger(name)
Usage in the application:
from logger import get_logger

logger = get_logger(__name__)

# Structured log call: key=value pairs become JSON fields
logger.info("order_created",
    order_id=order_id,
    item=req.item,
    quantity=req.quantity,
    duration_ms=round((time.time() - start) * 1000),
)

logger.error("order_processing_failed",
    item=req.item,
    quantity=req.quantity,
    error=str(exc),
)
Output to stdout:
{
  "timestamp": "2026-05-01T14:32:01Z",
  "level": "error",
  "event": "order_processing_failed",
  "order_id": "abc-123",
  "error": "database timeout"
}
Docker captures stdout from containers by default. Promtail reads Docker’s JSON log files and ships them to Loki.
Adding trace context to logs
In post 9 we add distributed tracing. To link log lines to traces, emit the trace_id as a log field. OpenTelemetry makes the current trace ID available from context:
from opentelemetry import trace

def get_trace_id() -> str:
    span = trace.get_current_span()
    ctx = span.get_span_context()
    if ctx.is_valid:
        return format(ctx.trace_id, "032x")
    return ""

# In request handlers, bind it to the logger context:
structlog.contextvars.bind_contextvars(trace_id=get_trace_id())
With merge_contextvars in the processor chain, every log call within the request automatically includes the trace_id. In Grafana, the derived field configuration in datasources.yml matches this field and renders it as a clickable link to the trace.
How the log pipeline works

Docker Compose additions
  loki:
    image: grafana/loki:3.7.1
    restart: unless-stopped
    ports:
      - "3100:3100"
    volumes:
      - ./loki/loki.yml:/etc/loki/local-config.yaml
      - loki-data:/loki
    command: -config.file=/etc/loki/local-config.yaml

  promtail:
    image: grafana/promtail:3.6.10
    restart: unless-stopped
    volumes:
      - /var/run/docker.sock:/var/run/docker.sock
      - ./promtail/promtail.yml:/etc/promtail/config.yml
      - promtail-positions:/tmp
    command: -config.file=/etc/promtail/config.yml

volumes:
  # ... existing volumes ...
  loki-data:
  promtail-positions:
Loki configuration
loki/loki.yml:
auth_enabled: false

server:
  http_listen_port: 3100

common:
  path_prefix: /loki
  storage:
    filesystem:
      chunks_directory: /loki/chunks
      rules_directory: /loki/rules
  replication_factor: 1
  ring:
    kvstore:
      store: inmemory

schema_config:
  configs:
    - from: 2020-10-24
      store: tsdb
      object_store: filesystem
      schema: v13
      index:
        prefix: index_
        period: 24h

limits_config:
  reject_old_samples: false
  allow_structured_metadata: true
This is a single-node Loki configuration using local filesystem storage — appropriate for development and small production workloads. For production scale, use object storage (S3, GCS) and a distributed Loki deployment.
Promtail configuration
promtail/promtail.yml:
server:
  http_listen_port: 9080
  grpc_listen_port: 0

positions:
  filename: /tmp/positions.yaml

clients:
  - url: http://loki:3100/loki/api/v1/push

scrape_configs:
  - job_name: docker
    docker_sd_configs:
      - host: unix:///var/run/docker.sock
        refresh_interval: 5s
    relabel_configs:
      - source_labels: [__meta_docker_container_label_com_docker_compose_service]
        target_label: service
      - source_labels: [__meta_docker_container_name]
        target_label: container
    pipeline_stages:
      - json:
          expressions:
            level: level
            event: event
            trace_id: trace_id
      - labels:
          level:
          service:
Promtail uses Docker service discovery (docker_sd_configs) to find all running containers automatically. The relabel_configs extract the Docker Compose service name as a Loki label. For the four-service demo system, this means logs from order-service, inventory-service, payment-service, and notification-service all land in Loki with the correct service label set automatically — no per-service Promtail configuration required.
The pipeline_stages section parses the JSON log output and promotes level and service to Loki labels. trace_id and event are parsed but not promoted to labels — they remain as log line content, searchable via LogQL but not indexed. Promoting high-cardinality values like trace_id to labels would recreate the cardinality problem from metrics.
LogQL
LogQL is Loki’s query language. It has two forms: log queries (return log lines) and metric queries (compute metrics from log lines).
Log queries
Select a log stream, then filter:
# All logs from the order service
{service="order-service"}

# Only errors
{service="order-service"} | json | level="error"

# Orders that took more than 200ms
{service="order-service"} | json | duration_ms > 200

# Search for a specific order ID
{service="order-service"} |= "abc-123"

# Events matching a pattern
{service="order-service"} | json | event="order_created"
With four services emitting structured logs with a shared trace_id, you can correlate a single request across the entire system:
# Follow a specific trace across all services
{service=~"order-service|inventory-service|payment-service|notification-service"}
  | json | trace_id="a3b7c9d2e1f0456789012345abcdef67"

# All errors across the whole system in one query
{service=~".+"} | json | level="error"

# Slow inventory reserve operations
{service="inventory-service"} | json | event="reserve_stock" | duration_ms > 200
The service=~".+" regex selector matches any service — useful for getting a system-wide error view during an incident without knowing in advance which service is affected.
Metric queries
Extract numeric metrics from log content:
# Request rate derived from logs
sum(rate({service="order-service"} | json | event="order_created" [5m]))

# Error rate from application logs
sum(rate({service="order-service"} | json | level="error" [5m]))

# p95 processing time extracted from log fields
histogram_quantile(0.95,
  sum(rate({service="order-service"}
    | json
    | unwrap duration_ms [5m]
  )) by (le)
)
Log-based metrics are useful when application metrics are not available — legacy services, third-party software, or processes you cannot instrument. They are slower and less precise than Prometheus metrics, but they exist.
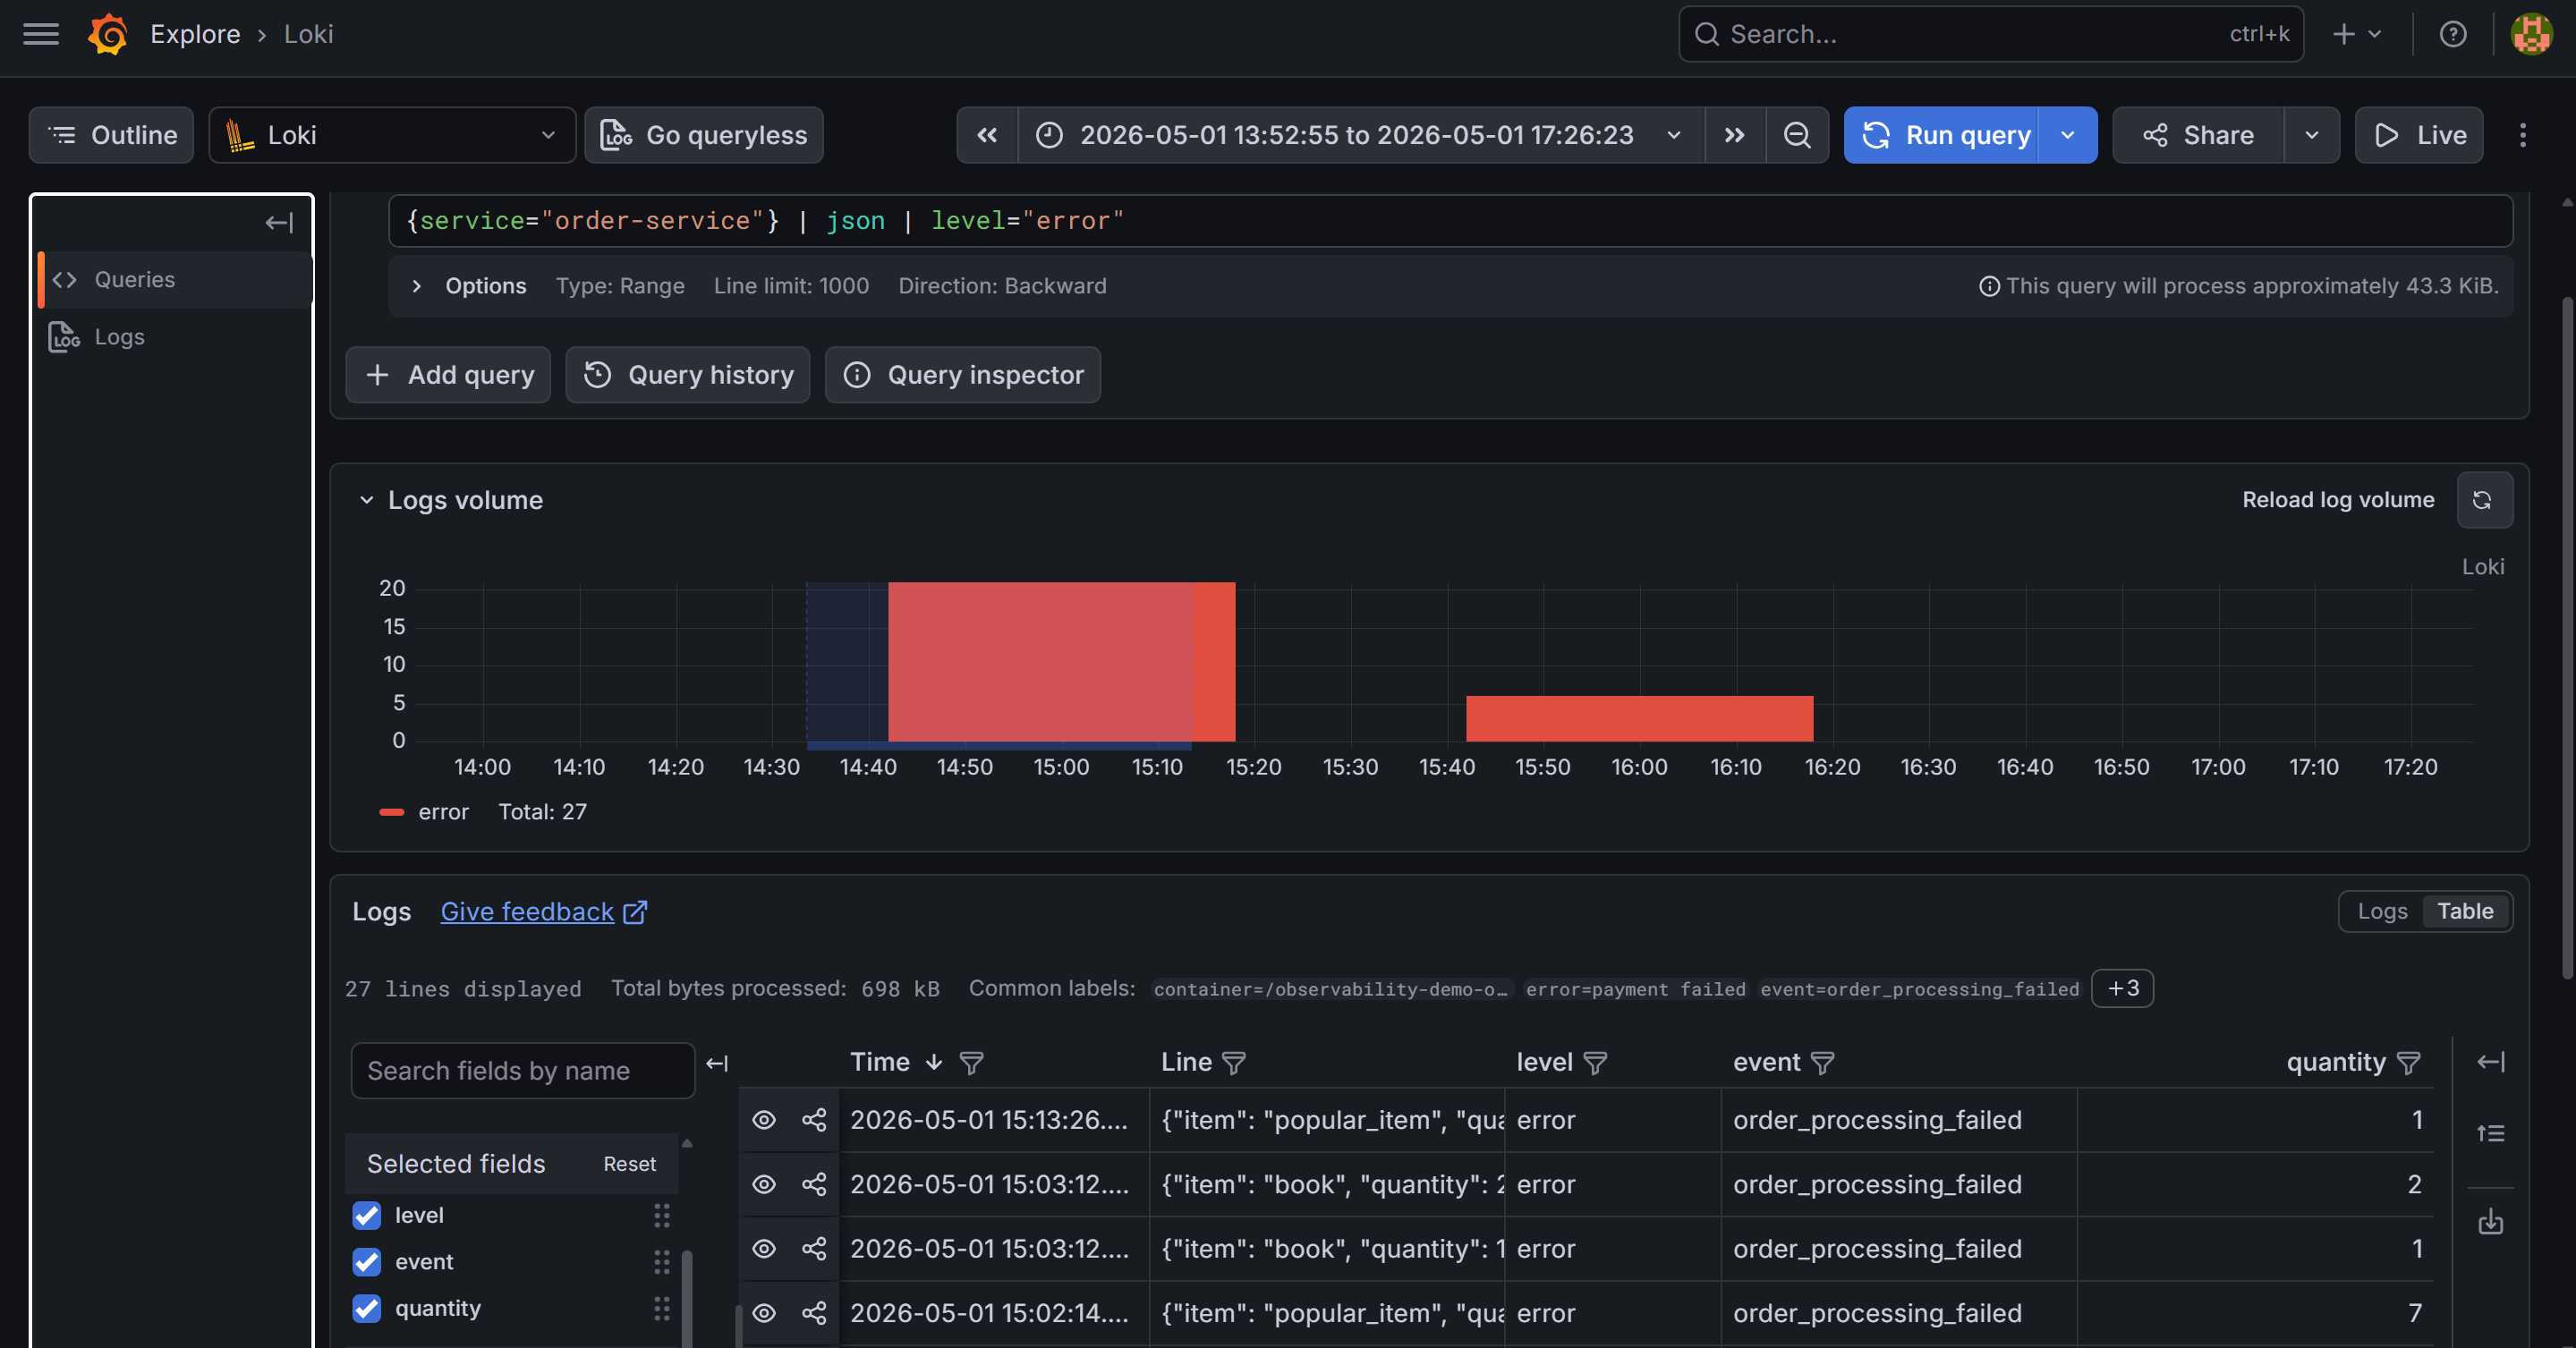
{service="order-service"} | json | level="error". The parsed JSON fields — level, event, order_id, quantity, trace_id — are visible in the log line preview panel.Grafana: the Logs panel
In Grafana, add a Logs panel to the service dashboard:
{
  "type": "logs",
  "title": "Application Logs",
  "datasource": {"type": "loki", "uid": "loki"},
  "targets": [
    {
      "expr": "{service=\"order-service\"}",
      "legendFormat": ""
    }
  ],
  "options": {
    "showTime": true,
    "showLabels": false,
    "wrapLogMessage": true,
    "prettifyLogMessage": true,
    "enableLogDetails": true
  }
}
The prettifyLogMessage: true option renders JSON log lines in a readable key-value format. enableLogDetails: true shows a detail drawer when you click a log line, listing all parsed fields including trace_id.
Derived fields: linking logs to traces
The datasource configuration in grafana/provisioning/datasources/datasources.yml includes:
jsonData:
  derivedFields:
    - matcherRegex: '"trace_id": "([a-f0-9]+)"'
      name: TraceID
      url: "$${__value.raw}"
      datasourceUid: tempo
The regex matches the raw log line as structlog emits it. Python’s json.dumps uses ": " (space after colon) by default, so the pattern needs the space — "trace_id":"..." without it will never match.
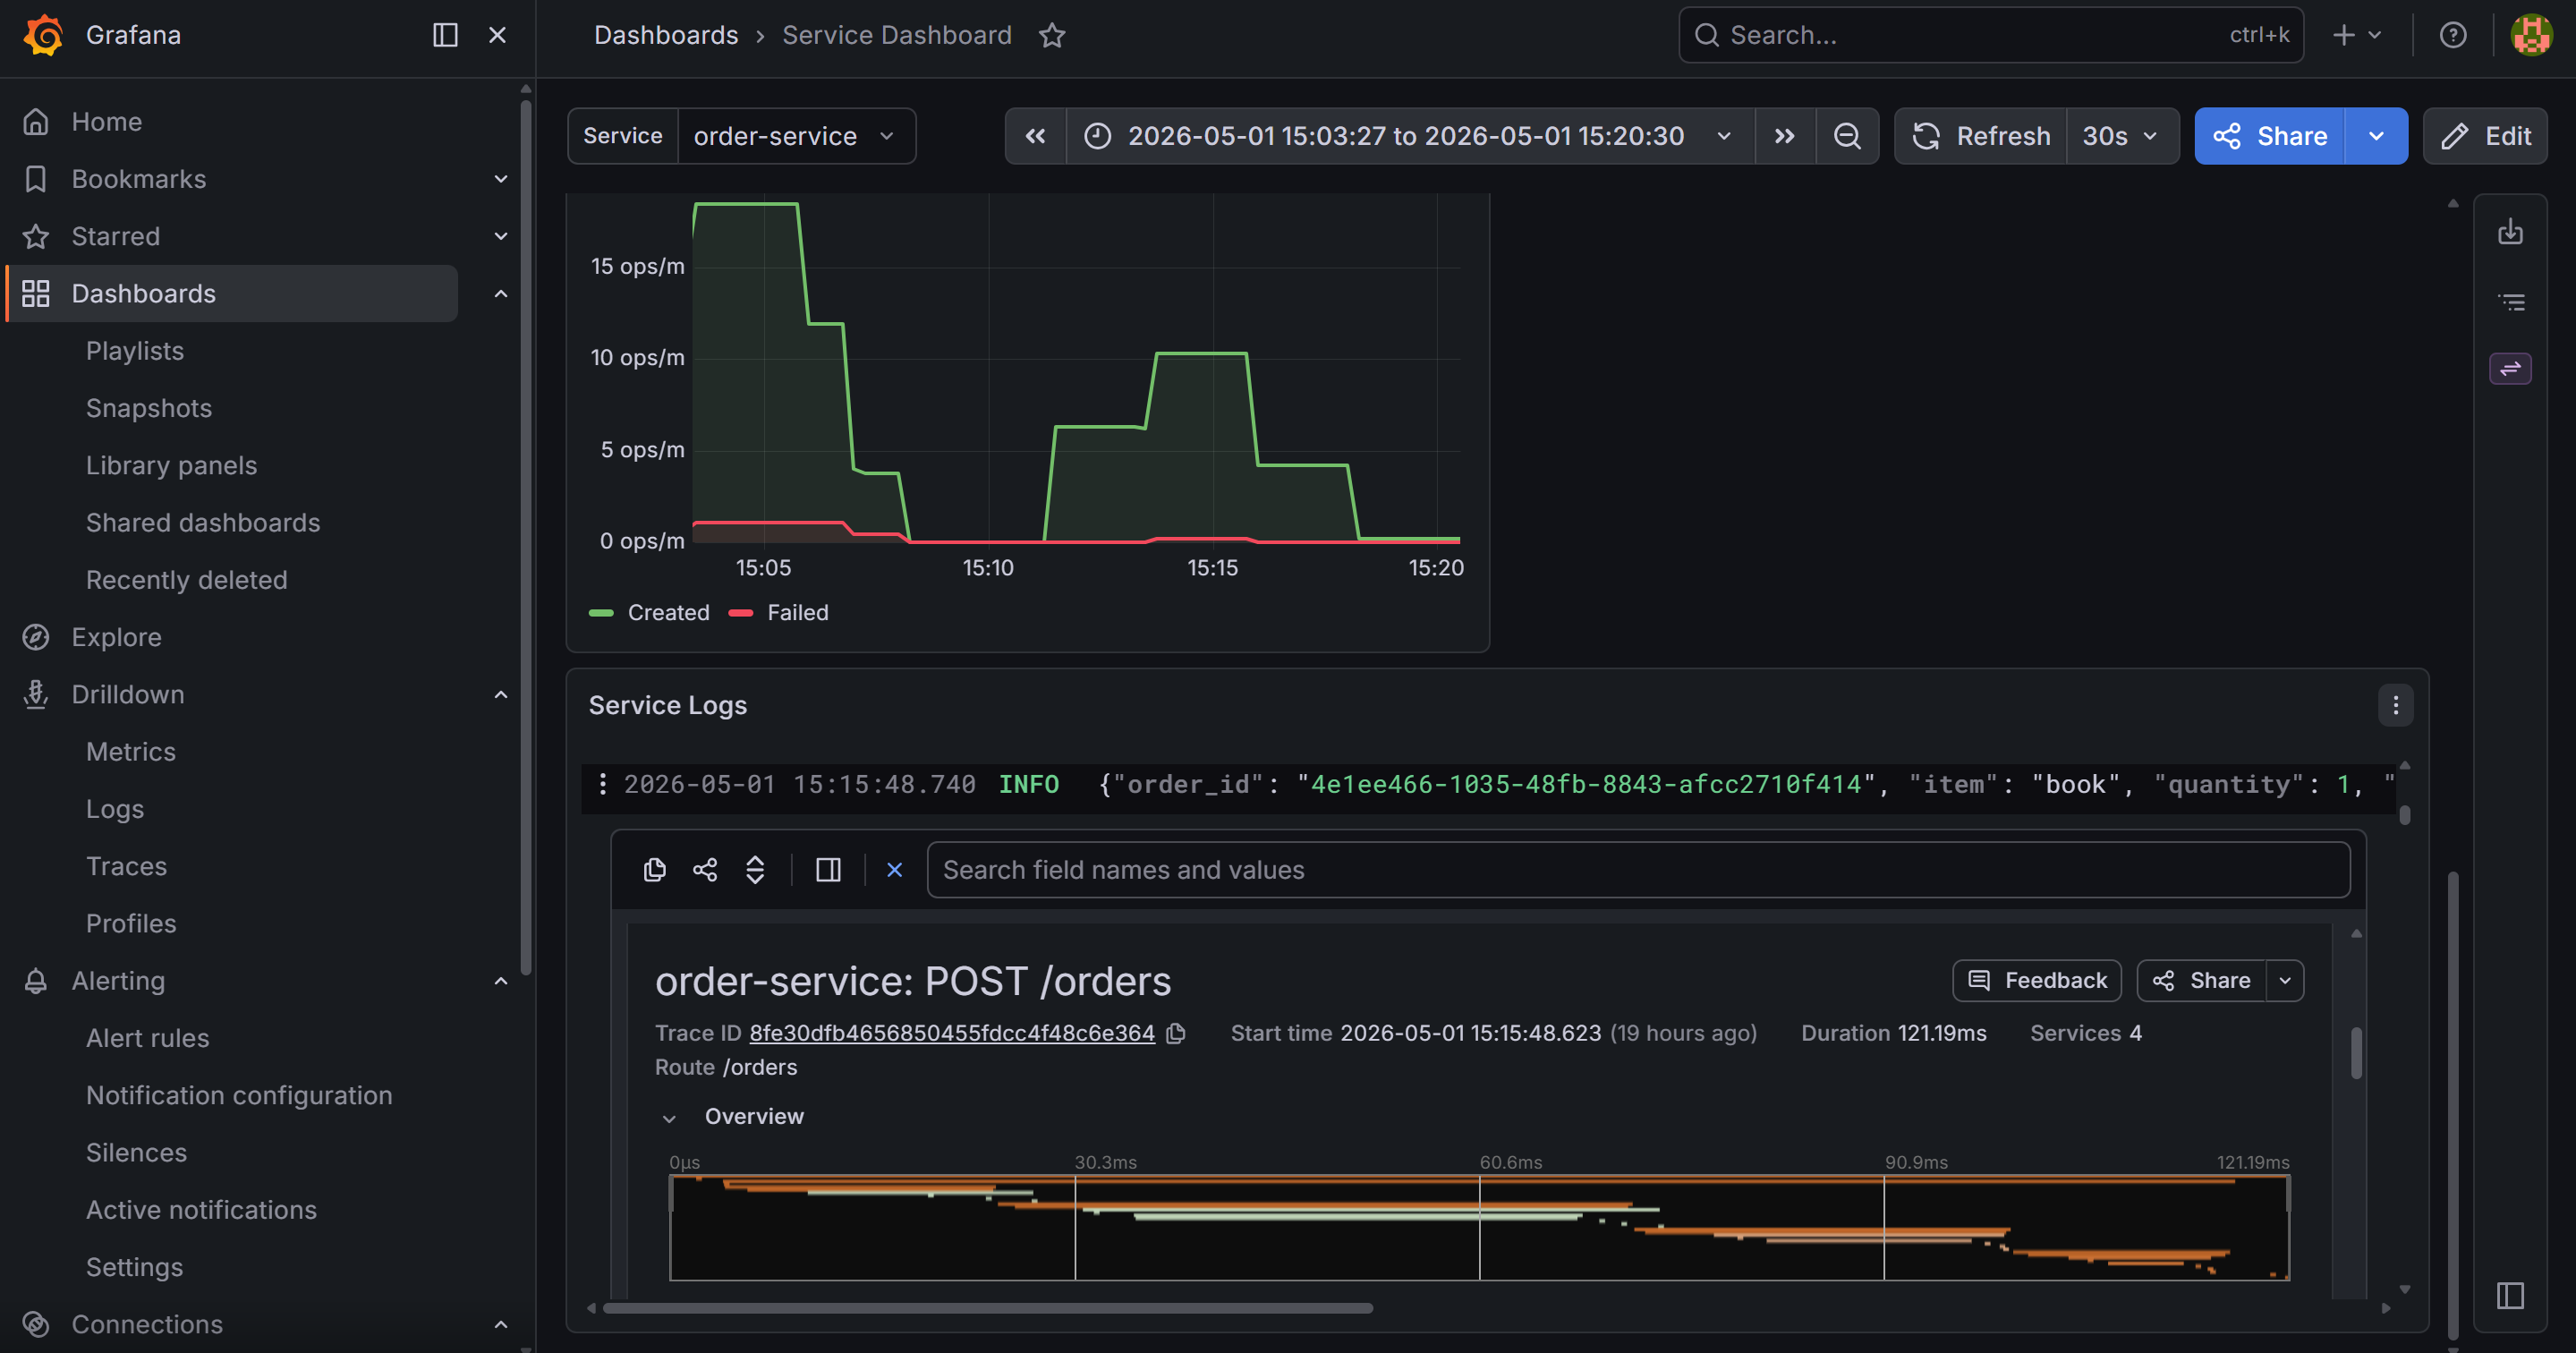
When Grafana renders a log line containing "trace_id": "abc123...", it adds a TraceID link button. Clicking a log line opens its detail drawer — parsed JSON fields on the left, and that blue TraceID button at the top. Clicking it opens the trace in Tempo directly. This is the log-to-trace link that makes incident investigation fast: one click from a log line to the full request trace.
What you have now
- Loki running on the local filesystem, receiving logs from Promtail via Docker service discovery
- Structured JSON logs from the Python service with
level,event, andtrace_idfields - Loki labels (
service,level) for efficient stream selection - LogQL for filtering, searching, and extracting metrics from logs
- A Logs panel in Grafana with
trace_idrendered as a clickable link to Tempo - An understanding of why Loki is cheaper than Elasticsearch for label-first query patterns
In the next post we close the loop: distributed tracing with OpenTelemetry and Tempo, instrumented in the Python service, visualized in Grafana.