
Prometheus: data model, metric types, and your first scrape
Contents
This is part 2 of the Production Observability series. In part 1 we established the theory. Now we run Prometheus, understand the data it collects, and add Node Exporter and cAdvisor to get host and container metrics from the start.
How Prometheus works
Prometheus is a pull-based metrics system. It does not wait for services to push data to it — it makes HTTP GET requests to each configured target on a regular interval (the scrape interval, default 1 minute; 15 seconds is common in practice). Each target exposes a /metrics endpoint returning plain text in the Prometheus exposition format:
# HELP http_requests_total Total HTTP requests
# TYPE http_requests_total counter
http_requests_total{method="GET",endpoint="/orders",status="200"} 1234
http_requests_total{method="POST",endpoint="/orders",status="500"} 7
Prometheus stores these samples in its built-in time-series database (TSDB). Each unique combination of metric name and label set is one time series.
The pull model has an important property: if Prometheus cannot reach a target, it records the scrape as failed and you can alert on up == 0. A silently dead service is immediately visible. Push-based systems lose this — a service that stopped pushing looks identical to one that just has nothing to report.
The data model
Every time series in Prometheus is identified by:
<metric_name>{<label_name>="<label_value>", ...}
- Metric name — what is being measured:
http_requests_total,node_cpu_seconds_total - Labels — key-value pairs that describe the specific instance:
{method="GET", endpoint="/orders", status="200"} - Value — a 64-bit float, recorded with a millisecond-precision timestamp
Labels are how you slice and aggregate. http_requests_total{status="200"} selects only successful requests. sum(http_requests_total) by (endpoint) aggregates across all methods and statuses, keeping only the endpoint dimension.
Every unique combination of metric name plus label values is a distinct time series stored in the TSDB. This is what cardinality means — more label values mean more time series, more memory, more disk, more query cost.
Metric types
Prometheus defines four metric types. The type tells both the client library how to expose the metric and PromQL which functions are valid for it.
Counter
A counter only ever increases (or resets to zero on process restart). Use it for anything you count: requests processed, errors thrown, bytes sent, jobs completed.
# Counts up. Never goes down.
http_requests_total{method="GET", endpoint="/orders", status="200"} 1234
The key rule: never graph a raw counter value. The absolute number tells you nothing useful — what matters is the rate of increase. In PromQL you always wrap counters in rate() or increase(). A counter at 1234 that stays at 1234 for five minutes means zero requests in that window. A counter at 1234 that was 1000 five minutes ago means 234 requests.
Gauge
A gauge is a number that can go up or down. Use it for current state: memory usage, active connections, queue depth, CPU temperature, number of in-flight requests.
# Reflects current state. Can go up or down.
orders_in_flight 3
process_resident_memory_bytes 52428800
You read gauges directly. You can apply avg_over_time(), max_over_time() etc. for smoothing, but there is no wrapping required.
Histogram
A histogram measures the distribution of observed values. When you call .observe(value), the client library increments every bucket whose upper bound is ≥ the observed value. After N observations you can compute approximate percentiles from the bucket counts.
A histogram with name http_request_duration_seconds produces three time series per label set:
# Count in each bucket (cumulative)
http_request_duration_seconds_bucket{endpoint="/orders", le="0.1"}  980
http_request_duration_seconds_bucket{endpoint="/orders", le="0.5"}  1190
http_request_duration_seconds_bucket{endpoint="/orders", le="1.0"}  1230
http_request_duration_seconds_bucket{endpoint="/orders", le="+Inf"} 1234

# Sum of all observed values
http_request_duration_seconds_sum{endpoint="/orders"} 127.4

# Total number of observations
http_request_duration_seconds_count{endpoint="/orders"} 1234
From this, histogram_quantile(0.99, ...) in PromQL estimates the p99 latency.
The accuracy of quantile estimates depends on bucket placement. If your p99 SLO is 200ms, you need buckets at and around 0.2s so that observations near the threshold land in narrow buckets. The Prometheus default buckets ([0.005, 0.01, 0.025, 0.05, 0.1, 0.25, 0.5, 1, 2.5, 5, 10]) are a reasonable starting point; tune them to cluster around your SLO boundaries.
Summary
A summary also measures distributions, but computes quantiles on the client side and emits them as separate time series:
http_request_duration_seconds{quantile="0.5"}  0.051
http_request_duration_seconds{quantile="0.99"} 0.312
The critical limitation: you cannot aggregate summaries across instances. There is no mathematically correct way to combine two p99 values from two different instances into a single service-wide p99. Histograms bucket counts can be summed before quantile calculation; summary quantiles cannot.
Use histograms by default. Use summaries only when you need very precise quantile values and are running a single instance of a service.
The cardinality trap
Cardinality is the total number of unique time series in Prometheus. It is the most common way teams break Prometheus in production.
Consider a http_requests_total counter with three labels:
method: 4 values (GET, POST, PUT, DELETE)endpoint: 10 values (/orders, /orders/{id}, /health…)status: 5 values (200, 201, 400, 404, 500)
Total time series: 4 × 10 × 5 = 200. Trivial.
Now imagine a team adds a user_id label “so we can filter by user in dashboards.” A service with 100,000 active users produces 200 × 100,000 = 20 million time series from that one metric. Prometheus runs out of memory. Scrape intervals start timing out. The entire system degrades.
Never use these as label values:
- User IDs, account IDs, session IDs, request IDs
- Email addresses or usernames
- Raw, un-normalized URLs (
/orders/abc-123instead of/orders/{id}) - Timestamps, version strings, or any value that grows unboundedly
The test: if a label value can grow proportionally to the number of users or requests your service handles, it is the wrong thing to label on. Labels should have a small, bounded, finite set of values — things like method, status, endpoint (normalized), environment, region.
When you genuinely need per-request or per-user data, that is what logs and traces are for.
Docker Compose setup
docker-compose.yml:
services:
  prometheus:
    image: prom/prometheus:v3.11.3
    restart: unless-stopped
    ports:
      - "9090:9090"
    volumes:
      - ./prometheus/prometheus.yml:/etc/prometheus/prometheus.yml
      - ./prometheus/rules:/etc/prometheus/rules
      - prometheus-data:/prometheus
    command:
      - --config.file=/etc/prometheus/prometheus.yml
      - --storage.tsdb.retention.time=15d
      - --web.enable-lifecycle
      - --enable-feature=exemplar-storage,otlp-write-receiver
      - --web.enable-remote-write-receiver
    extra_hosts:
      - "host.docker.internal:host-gateway"

  node-exporter:
    image: prom/node-exporter:v1.11.1
    restart: unless-stopped
    ports:
      - "9100:9100"
    volumes:
      - /proc:/host/proc:ro
      - /sys:/host/sys:ro
      - /:/rootfs:ro
    command:
      - --path.procfs=/host/proc
      - --path.sysfs=/host/sys
      - --path.rootfs=/rootfs
      - --collector.filesystem.mount-points-exclude=^/(sys|proc|dev|host|etc)($$|/)

  cadvisor:
    image: gcr.io/cadvisor/cadvisor:v0.55.1
    restart: unless-stopped
    privileged: true
    volumes:
      - /:/rootfs:ro
      - /var/run:/var/run:ro
      - /sys:/sys:ro
      - /var/lib/docker:/var/lib/docker:ro
    ports:
      - "8082:8080"

volumes:
  prometheus-data:
One thing about Node Exporter worth noting: some guides run it with network_mode: host and pid: host so it can see the host’s full network interfaces and PID namespace. On Docker Desktop and WSL2, network_mode: host does not share the WSL2 host network — it binds to the Docker VM’s network instead, which makes Prometheus unable to reach it by hostname. The simpler approach, used here, is to keep Node Exporter on the default bridge network with a port mapping (9100:9100) and scrape it from Prometheus by service name. Host-level filesystem and CPU metrics still work correctly via the /proc and /sys bind mounts.
Prometheus configuration
prometheus/prometheus.yml:
global:
  scrape_interval: 15s
  evaluation_interval: 15s

rule_files:
  - /etc/prometheus/rules/*.yml

scrape_configs:
  - job_name: prometheus
    static_configs:
      - targets: ["localhost:9090"]

  - job_name: node
    static_configs:
      - targets: ["node-exporter:9100"]

  - job_name: cadvisor
    static_configs:
      - targets: ["cadvisor:8080"]

  - job_name: order-service
    static_configs:
      - targets: ["order-service:8001"]

  - job_name: inventory-service
    static_configs:
      - targets: ["inventory-service:8002"]

  - job_name: payment-service
    static_configs:
      - targets: ["payment-service:8003"]

  - job_name: notification-service
    static_configs:
      - targets: ["notification-service:8004"]
Start the stack:
docker compose up -d
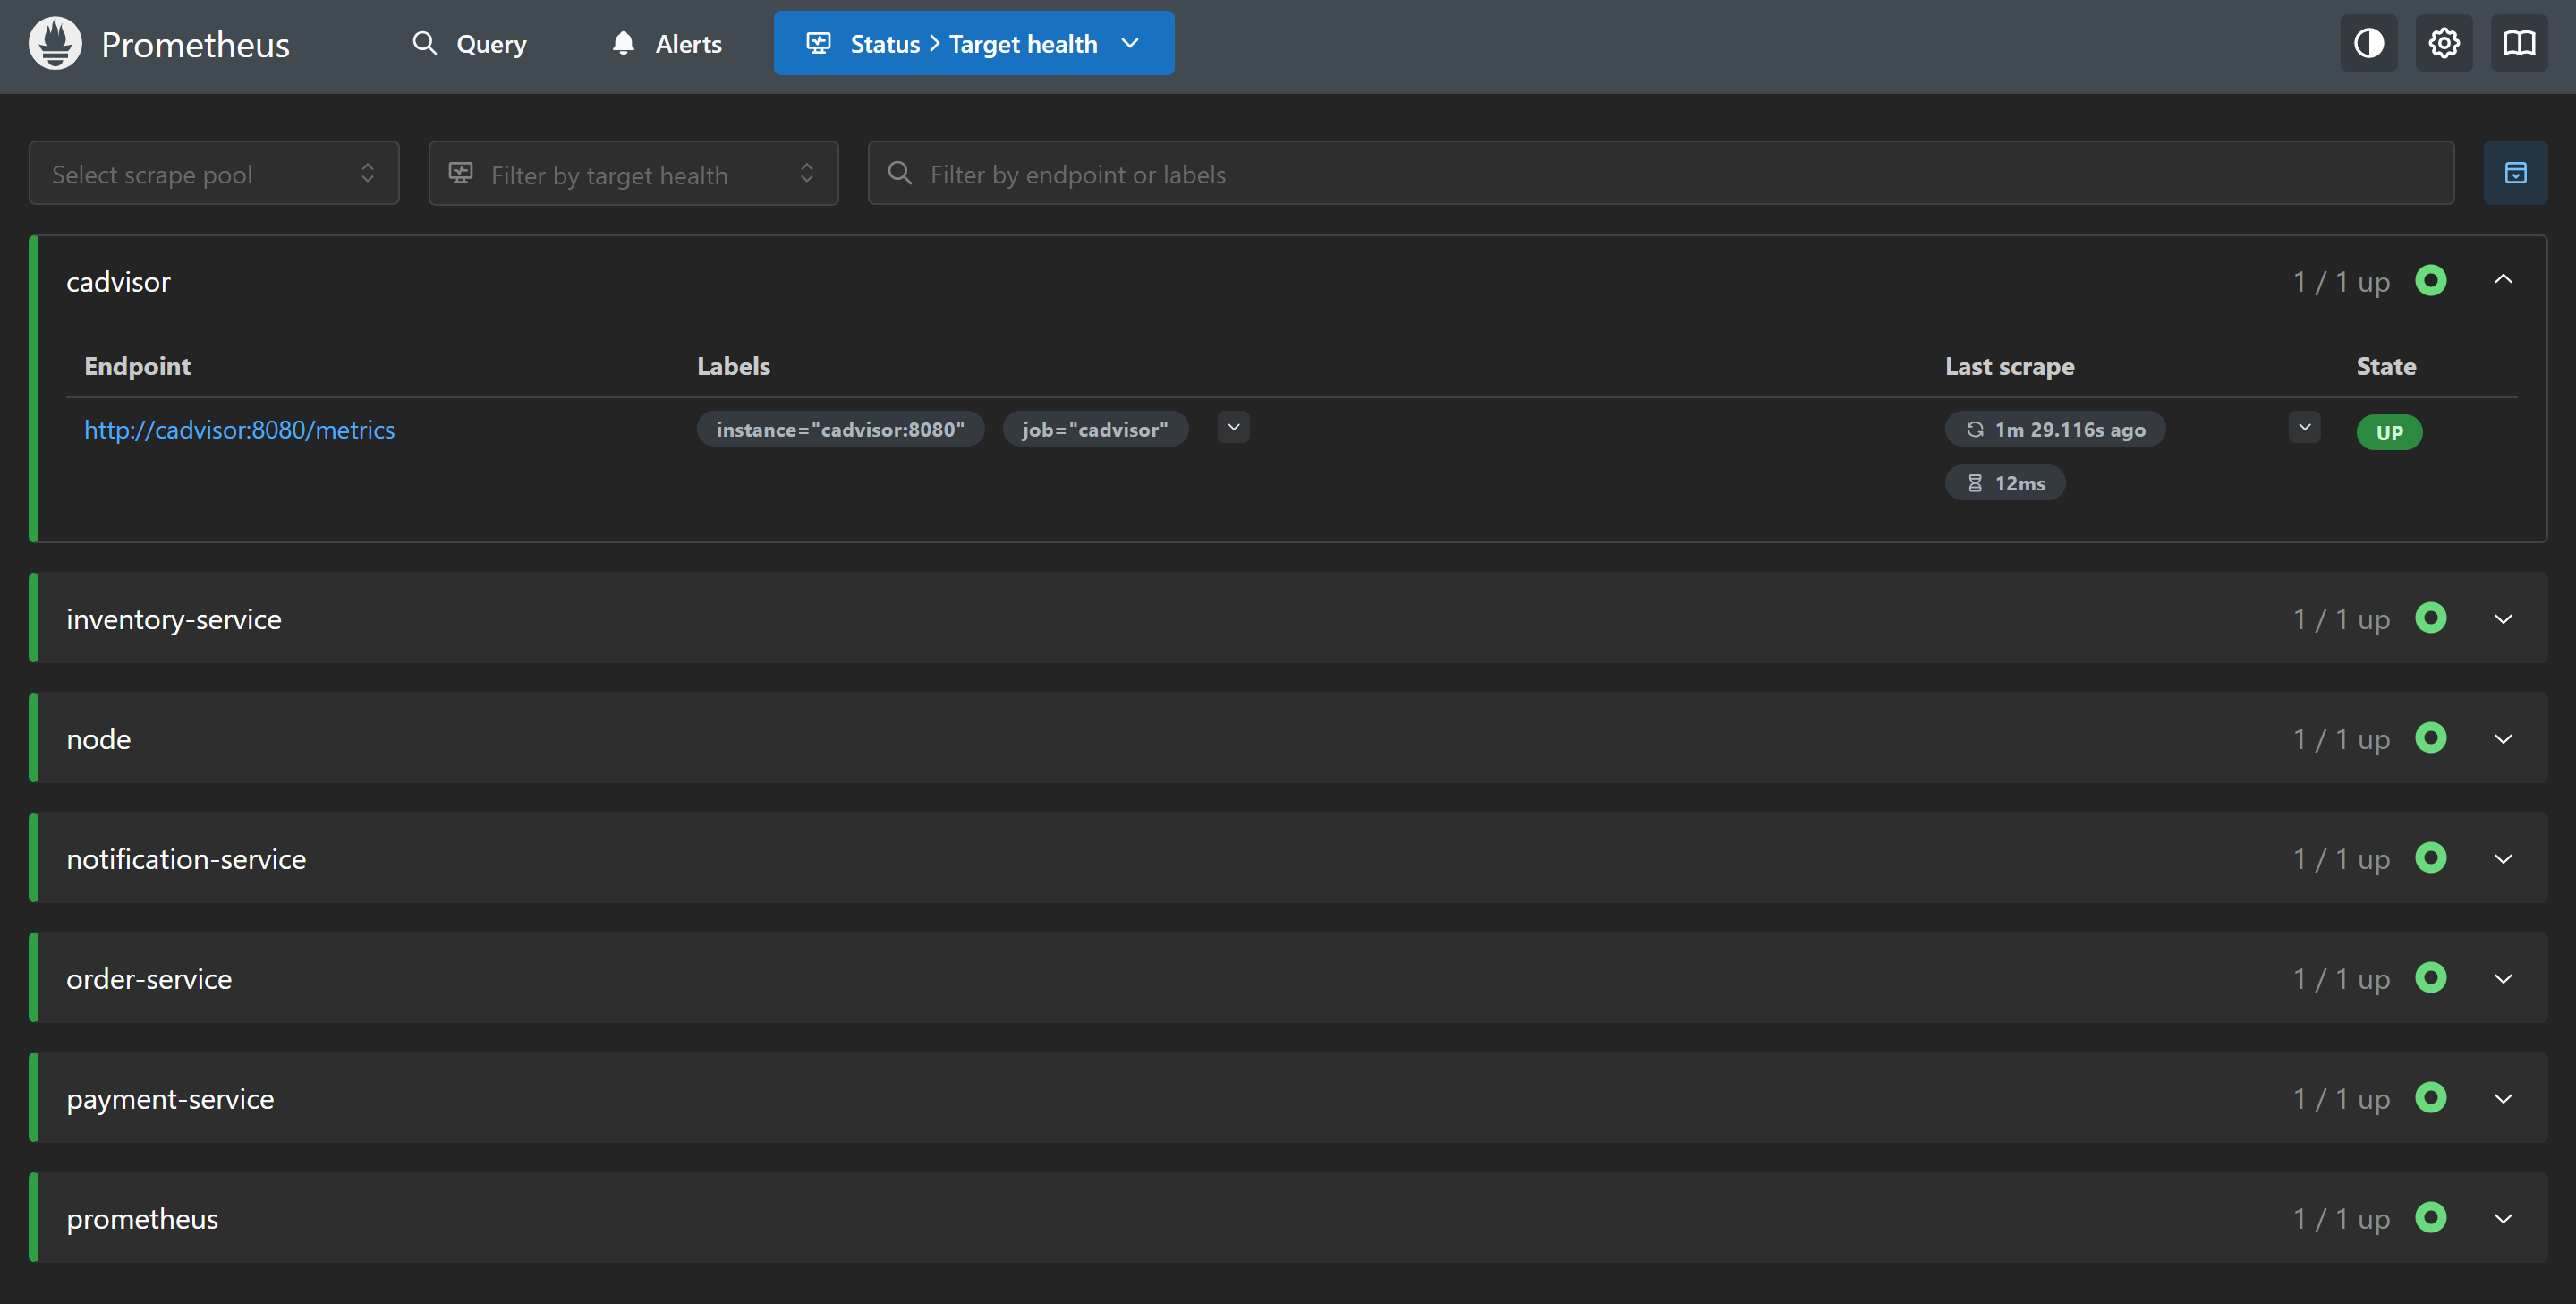
Open http://localhost:9090. Go to Status → Targets and verify both node and cadvisor show as UP with a recent Last Scrape timestamp. A green UP means the last scrape succeeded. A red DOWN means Prometheus cannot reach the target — check the error message, usually a connection refused or a wrong port.
Exploring the data
Open the Prometheus expression browser (the Graph tab) and try a few queries to verify data is flowing:
# User-space CPU across all cores
rate(node_cpu_seconds_total{mode="user"}[5m])

# Total system memory in GB
node_memory_MemTotal_bytes / 1024 / 1024 / 1024

# Free memory as a fraction
node_memory_MemAvailable_bytes / node_memory_MemTotal_bytes

# Disk read throughput in MB/s
rate(node_disk_read_bytes_total[5m]) / 1024 / 1024

# Container memory (working set, by container name)
container_memory_working_set_bytes{container!=""}
These are exploratory queries — not dashboards yet. We will build those in post 5. For now, the goal is confirming the pipeline works: Prometheus scrapes Node Exporter, stores the data, and you can retrieve it.
![Prometheus Graph tab showing rate(node_cpu_seconds_total{mode='user'}[5m]) plotted as a time series](/assets/images/observability-series/prometheus-query.png)
rate(node_cpu_seconds_total{mode="user"}[5m]) in the Prometheus expression browser — one line per CPU core, showing user-space CPU utilisation over the last 5 minutes.Prometheus feature flags
--web.enable-lifecycle exposes a POST /-/reload endpoint that re-reads the configuration and rule files without a restart. Useful during development when iterating on alert rules:
curl -X POST http://localhost:9090/-/reload
--enable-feature=exemplar-storage,otlp-write-receiver enables two things: storing exemplars (trace ID annotations on histogram samples, used in post 9 to jump from a latency spike to the trace that caused it) and accepting metrics over the OpenTelemetry Protocol.
--web.enable-remote-write-receiver enables Prometheus’s remote write endpoint at /api/v1/write. This is required in Prometheus v3 for Tempo’s metrics generator to push service graph and span metrics into Prometheus.
What you have now
- Prometheus scraping itself, Node Exporter, and cAdvisor every 15 seconds
- Host CPU, memory, disk I/O, filesystem, and network metrics from Node Exporter
- Per-container CPU, memory, and network I/O from cAdvisor
- 15-day retention window in the local TSDB
- A place to put recording rules and alert rules in
prometheus/rules/
In the next post we add the application layer: RED metrics from the Python order service, including the /metrics endpoint, middleware-based request tracking, and custom business metrics.