
The incident: correlating metrics, logs, and traces in Grafana Explore
Contents
This is part 10 of the Production Observability series. We have all three pillars running: metrics in Prometheus (parts 2–4), dashboards in Grafana (part 5), SLO alerts (part 6), Alertmanager (part 7), logs in Loki (part 8), and traces in Tempo (part 9). Now we use them together.
The scenario
An alert fires in #incidents:
:rotating_light: CRITICAL: Fast error budget burn on order-service

Error budget is exhausting faster than the 2-hour burn rate threshold.

Runbook: https://github.com/mguarinos/observability-demo/wiki/runbooks/error-budget-burn
You are on call. You open Grafana.
Two defects are active simultaneously. The first is the bug we planted in post 9: inventory-service has a slow path for high-demand stock reserves (quantity > 5), adding 270ms+ to those requests. The second is a pre-existing 5% random failure rate in payment-service. Under normal traffic this failure rate is tolerable. Under a burst, both defects amplify: the slow reserve path inflates tail latency for all orders, and the higher request volume turns a 5% failure rate into enough absolute errors to burn the error budget.
Simulate the burst:
for i in $(seq 1 100); do
  curl -s -X POST http://localhost:8001/orders \
    -H "Content-Type: application/json" \
    -d "{\"item\": \"popular_item\", \"quantity\": $((RANDOM % 5 + 6)), \"price\": 49.99}" &
done
wait
All 100 requests use quantity > 5, hitting the slow inventory path. The alert fires. You start investigating.
Step 1: Metrics — understand the scope
Open the service dashboard in Grafana. Set the time range to Last 5 minutes.
The Error Rate stat panel for order-service is red: currently 5.73%. The p99 Latency panel shows 2.38 seconds. The Request Rate is elevated.
The spike is sharp — p99 jumped from a ~60ms baseline to 2.38s at the start of the burst. p50 moves much less. Percentile divergence: tail requests are slow, not all requests.
Run this query to see per-service latency:
histogram_quantile(0.99,
  sum(rate(http_request_duration_seconds_bucket[2m])) by (le, job, endpoint)
)
Result: order-service POST /orders p99 is 2.38s. Now check inventory-service:
histogram_quantile(0.99,
  sum(rate(http_request_duration_seconds_bucket{job="inventory-service"}[2m])) by (le, endpoint)
)
Result: inventory-service p99 is 495ms — far above its normal baseline. The GET stock-check endpoint stays near flat. Only the reserve path is slow.
This is the first signal that the problem might not be inside order-service. The latency comes from somewhere downstream. But the metrics alone cannot tell you whether inventory-service is slow because order-service is hammering it with unusual traffic, or whether inventory-service has an internal defect. You need logs and a trace to decide.
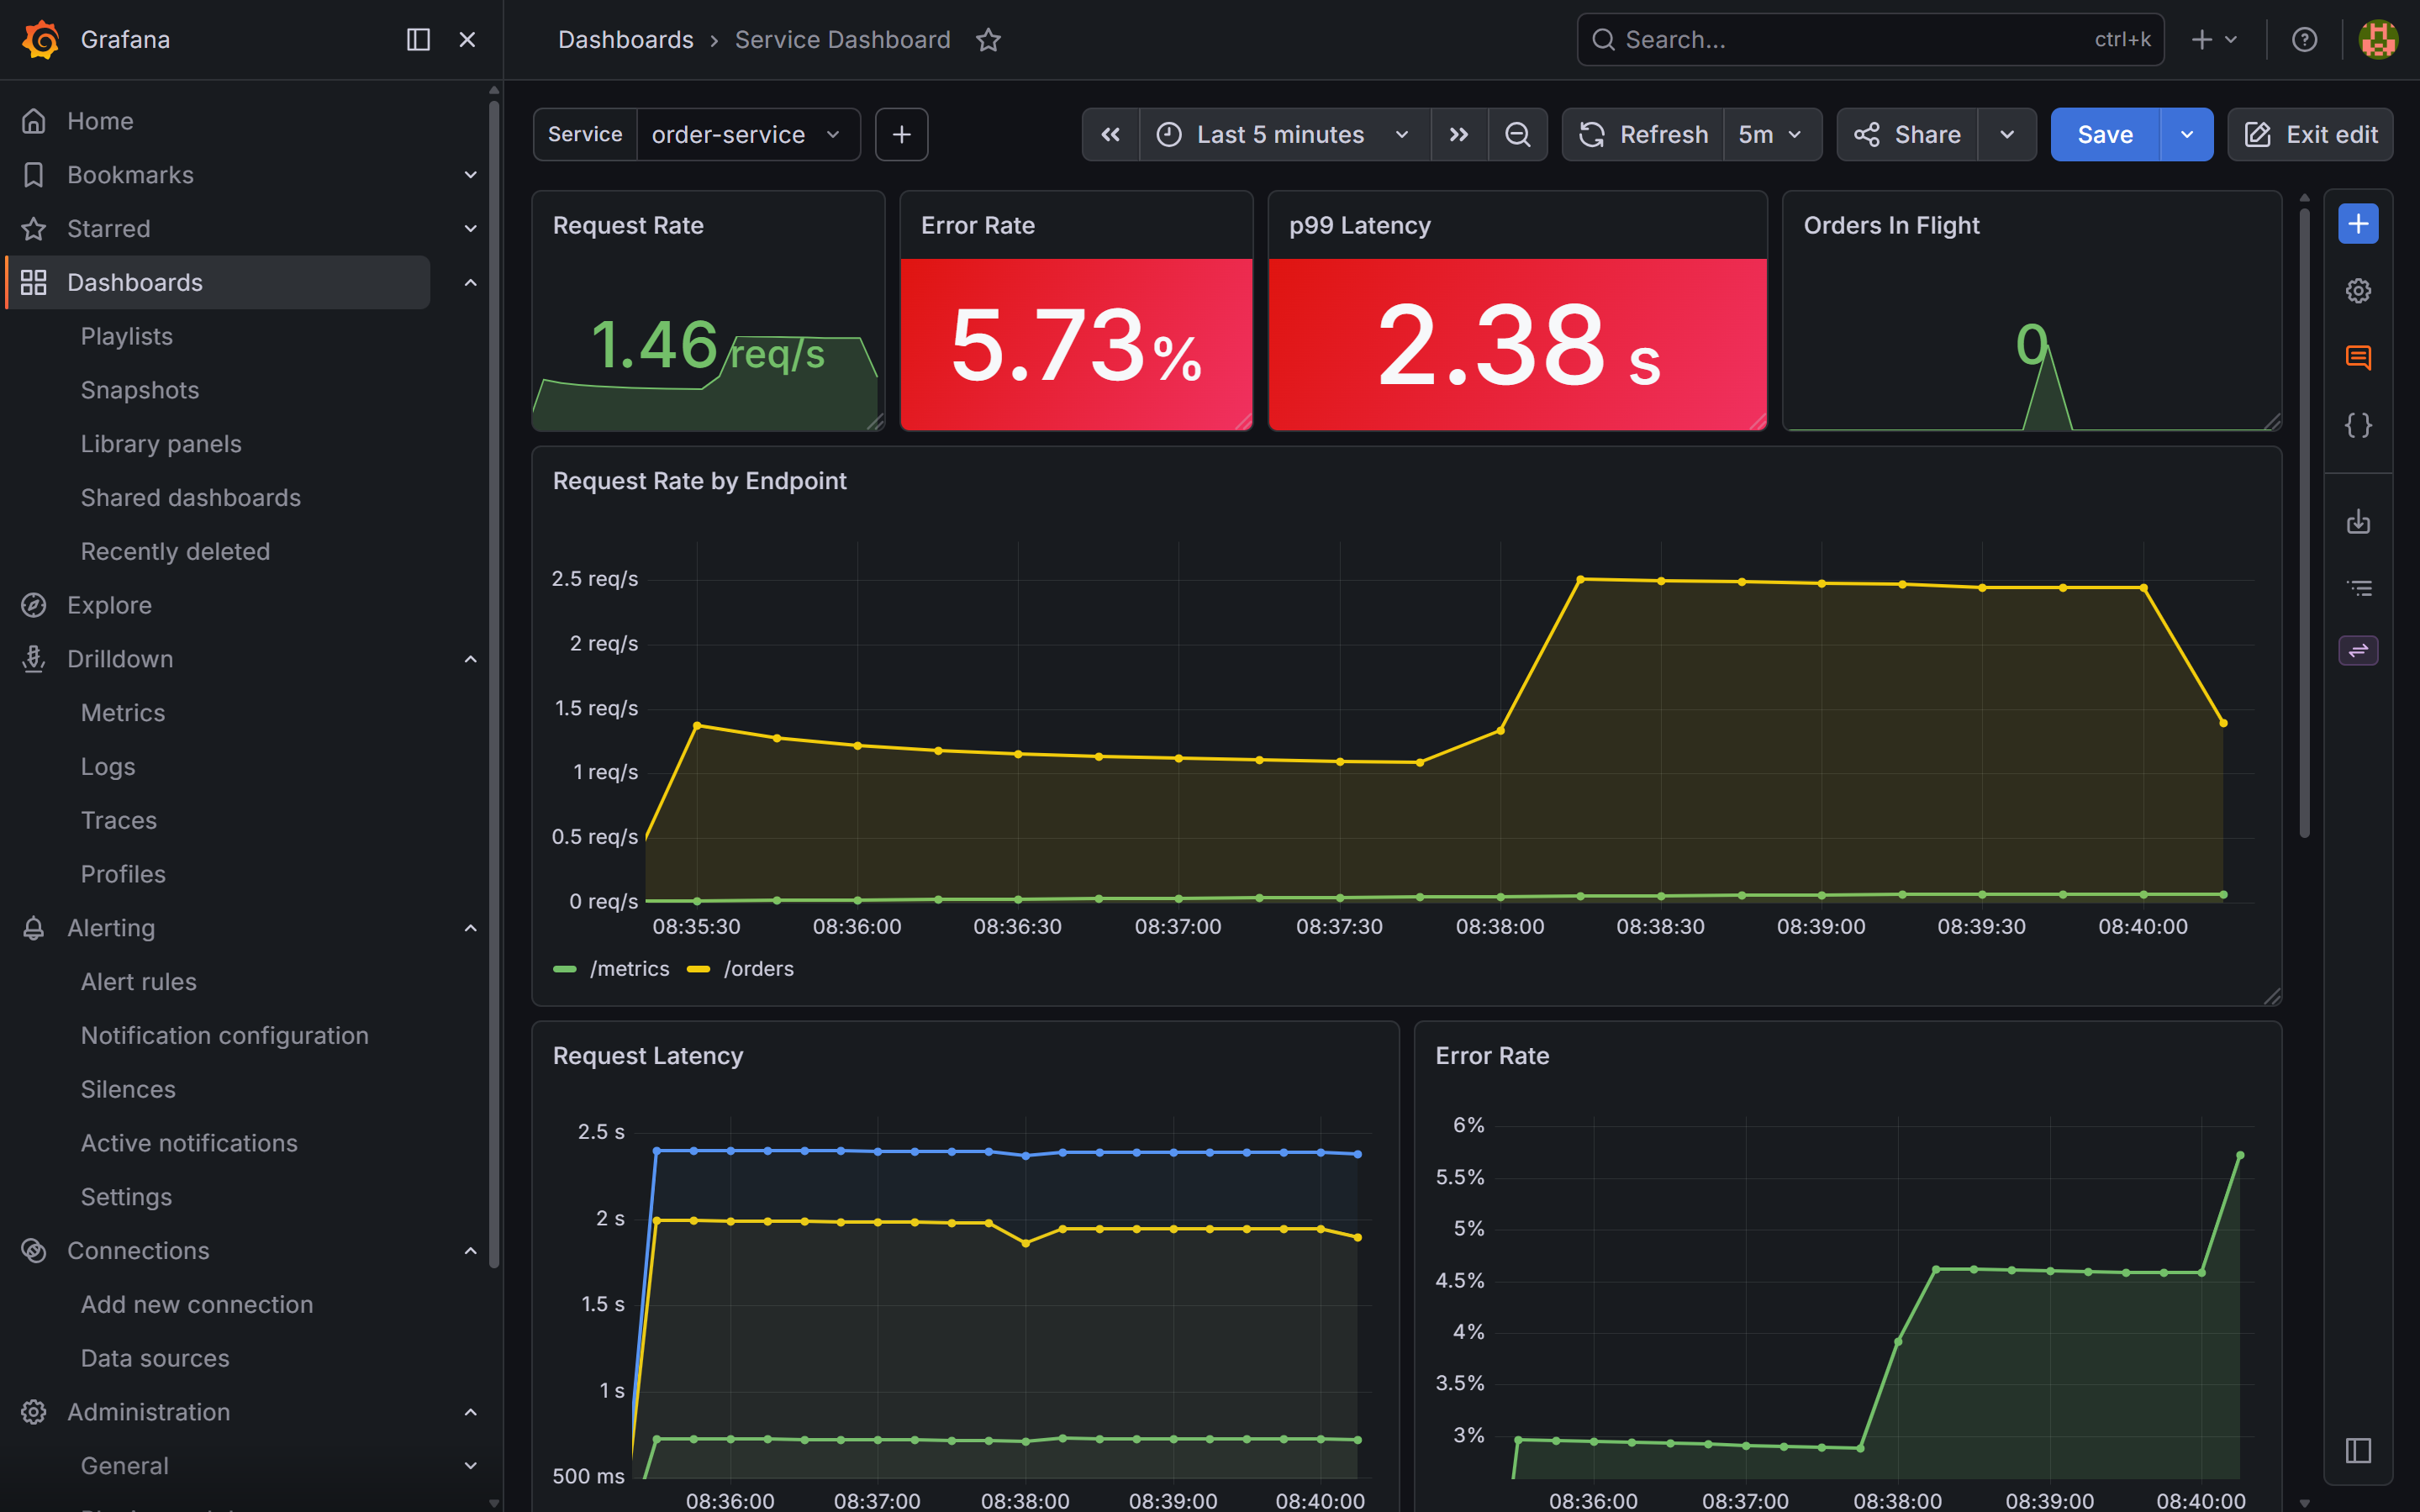
order-service dashboard, time range set to the last 5 minutes. The Error Rate stat panel is red at 5.73% — above the SLO threshold that triggered the burn-rate alert. The p99 Latency panel shows 2.38s, a sharp jump from the ~60ms baseline at the start of the burst. p50 barely moves, which is the first diagnostic clue: tail requests are slow, not all of them.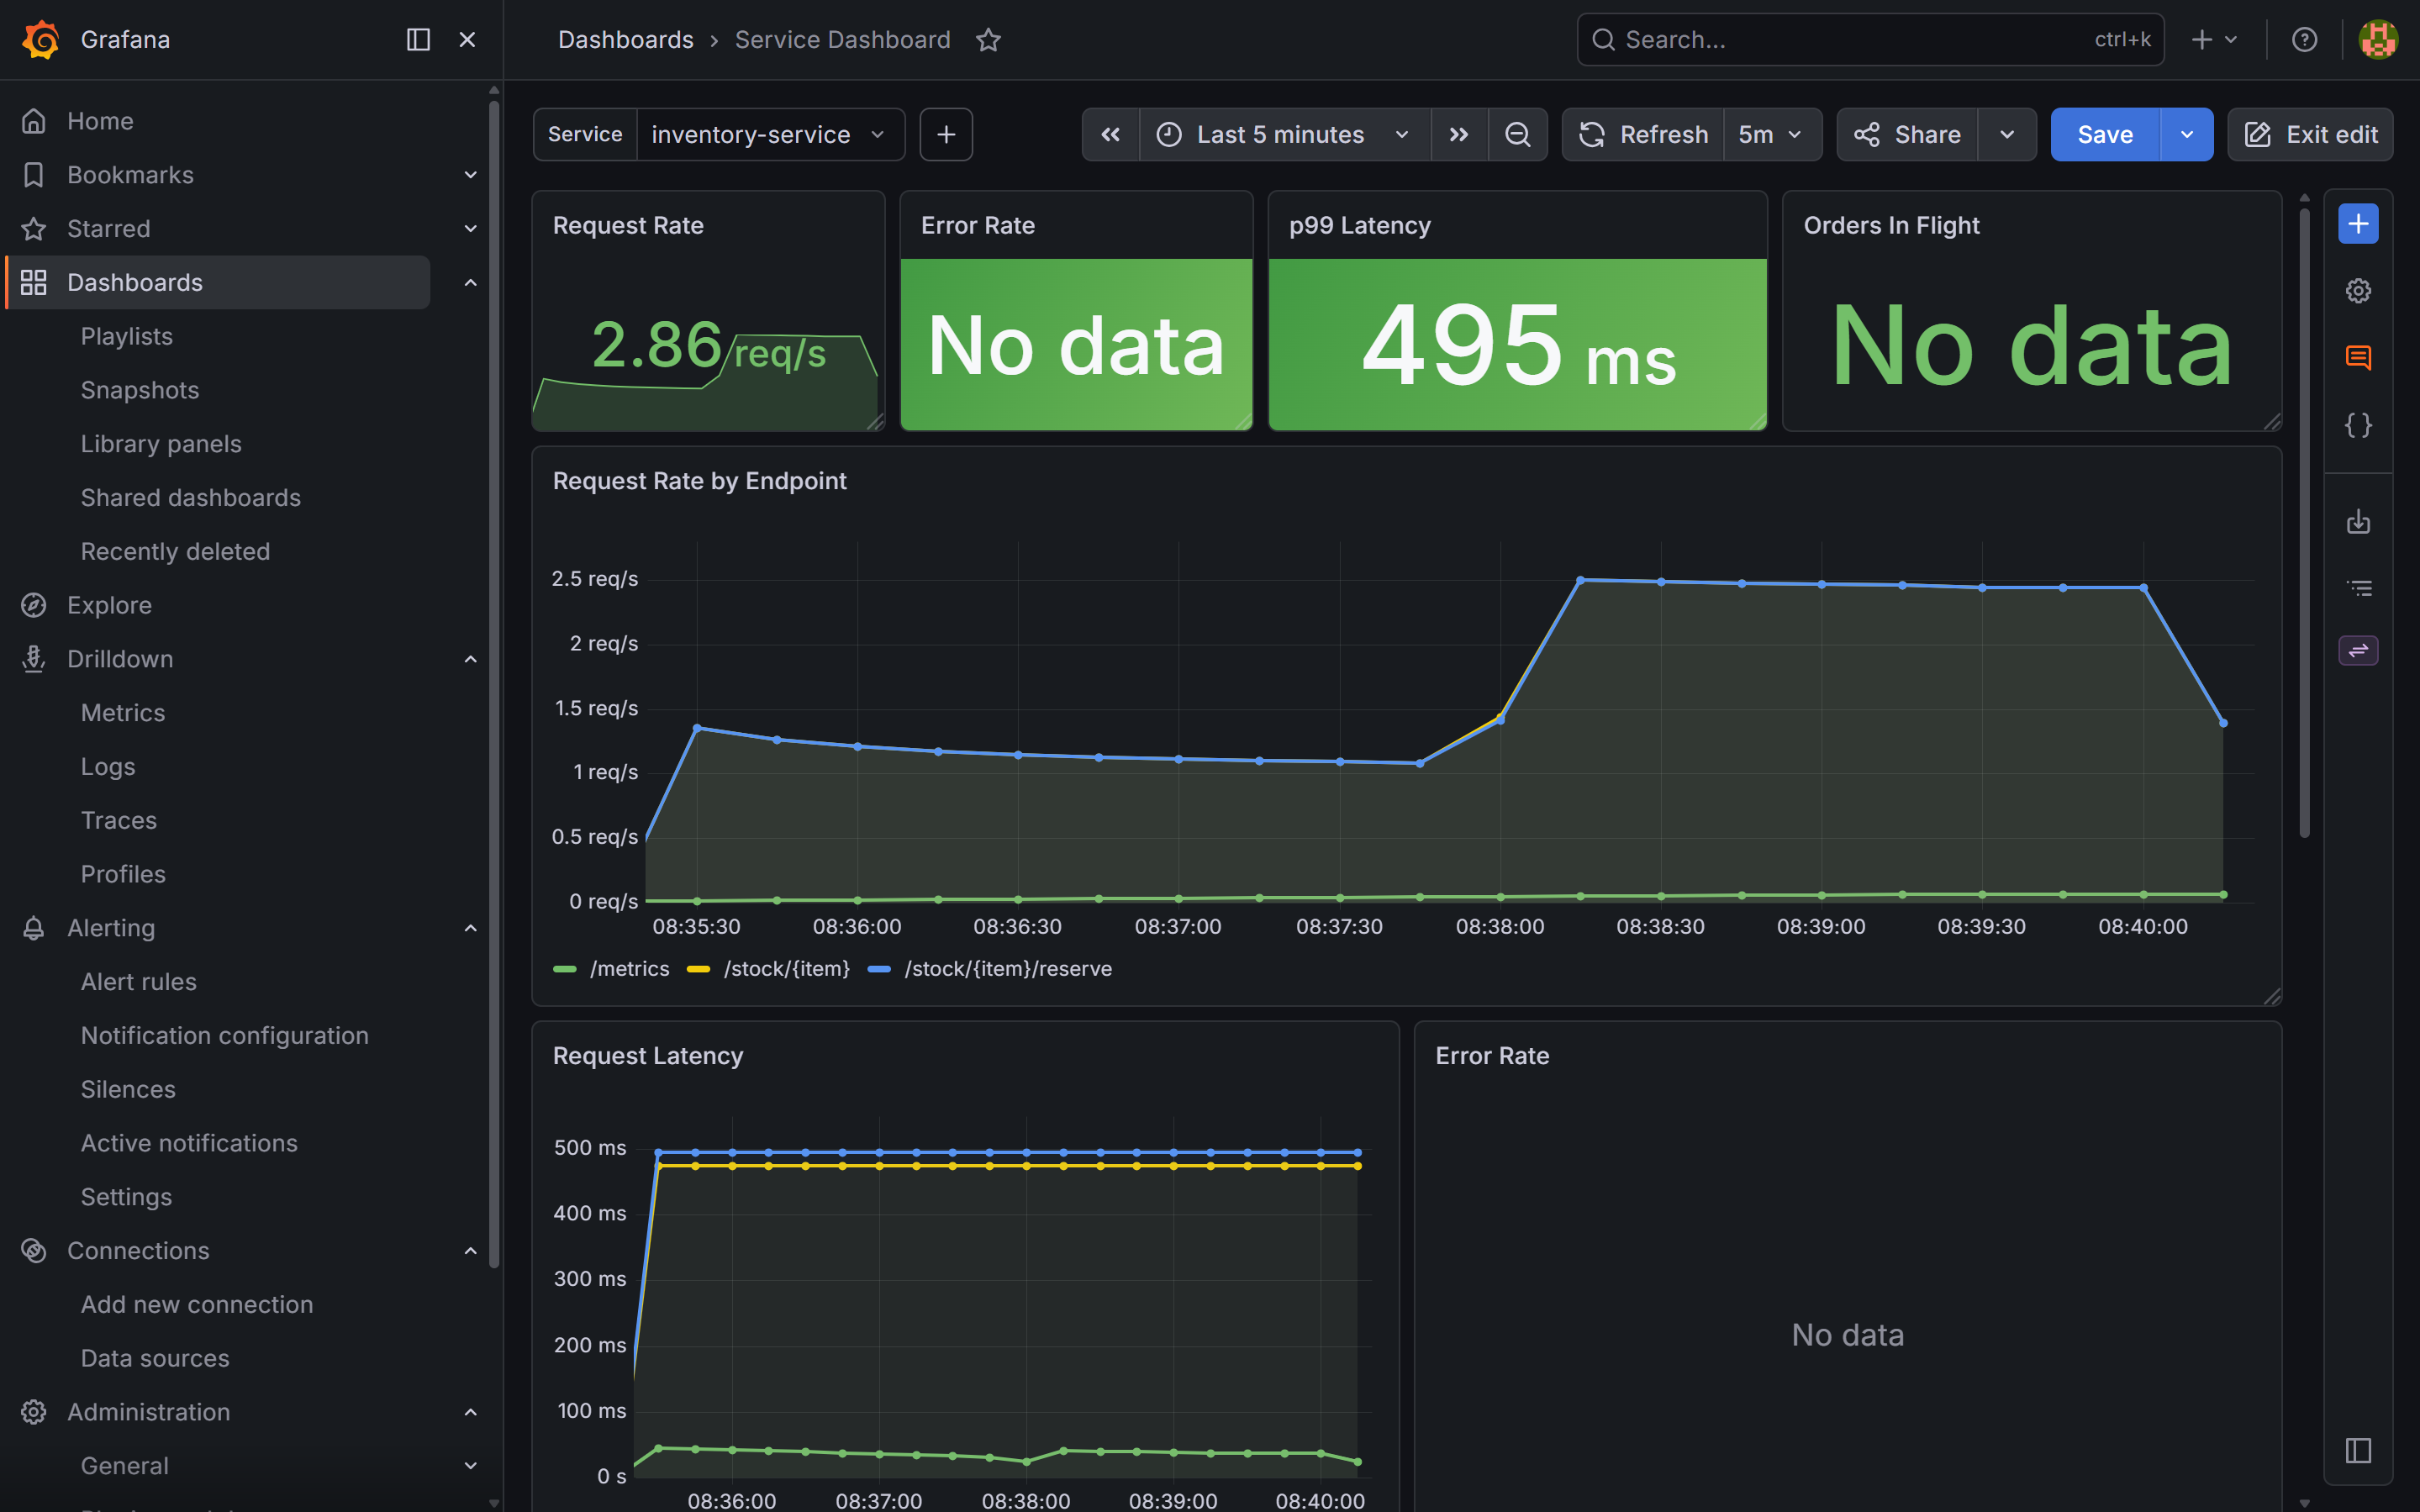
inventory-service dashboard over the same window. The p99 Latency stat panel shows 495ms — far above the normal baseline. No errors: inventory-service is slow but not failing.Step 2: Logs — find the pattern
Switch to Grafana Explore → select the Loki datasource. Set the time range to Last 15 minutes.
Start with order-service errors:
{service="order-service"} | json | level="error"
A cluster of error log lines appears. Each one says:
{
  "item": "popular_item",
  "quantity": 9,
  "error": "payment failed",
  "event": "order_processing_failed",
  "trace_id": "566acdc19b877beb6c75892a54376696",
  "level": "error",
  "timestamp": "2026-05-03T06:37:57.625976Z"
}
The error is payment failed — order-service is propagating a failure from the payment call. quantity: 9 is above the slow-path threshold, and trace_id is present.
This might look like a payment problem. The instinct is to go look at payment-service. That is the wrong move. Check inventory-service logs first:
{service="inventory-service"} | json | level="error"
No results. inventory-service logs no errors — it handles all reserve requests at INFO level and returns 200, just slowly. The 495ms p99 you saw in the dashboard is not causing failures in inventory-service itself. It is causing order-service to wait 270ms+ per order, stacking up under concurrent load and driving the p99 to 2.38s.
The logs tell you where the errors come from (payment). The metrics tell you where the latency comes from (inventory). The trace is what shows you both in a single view.
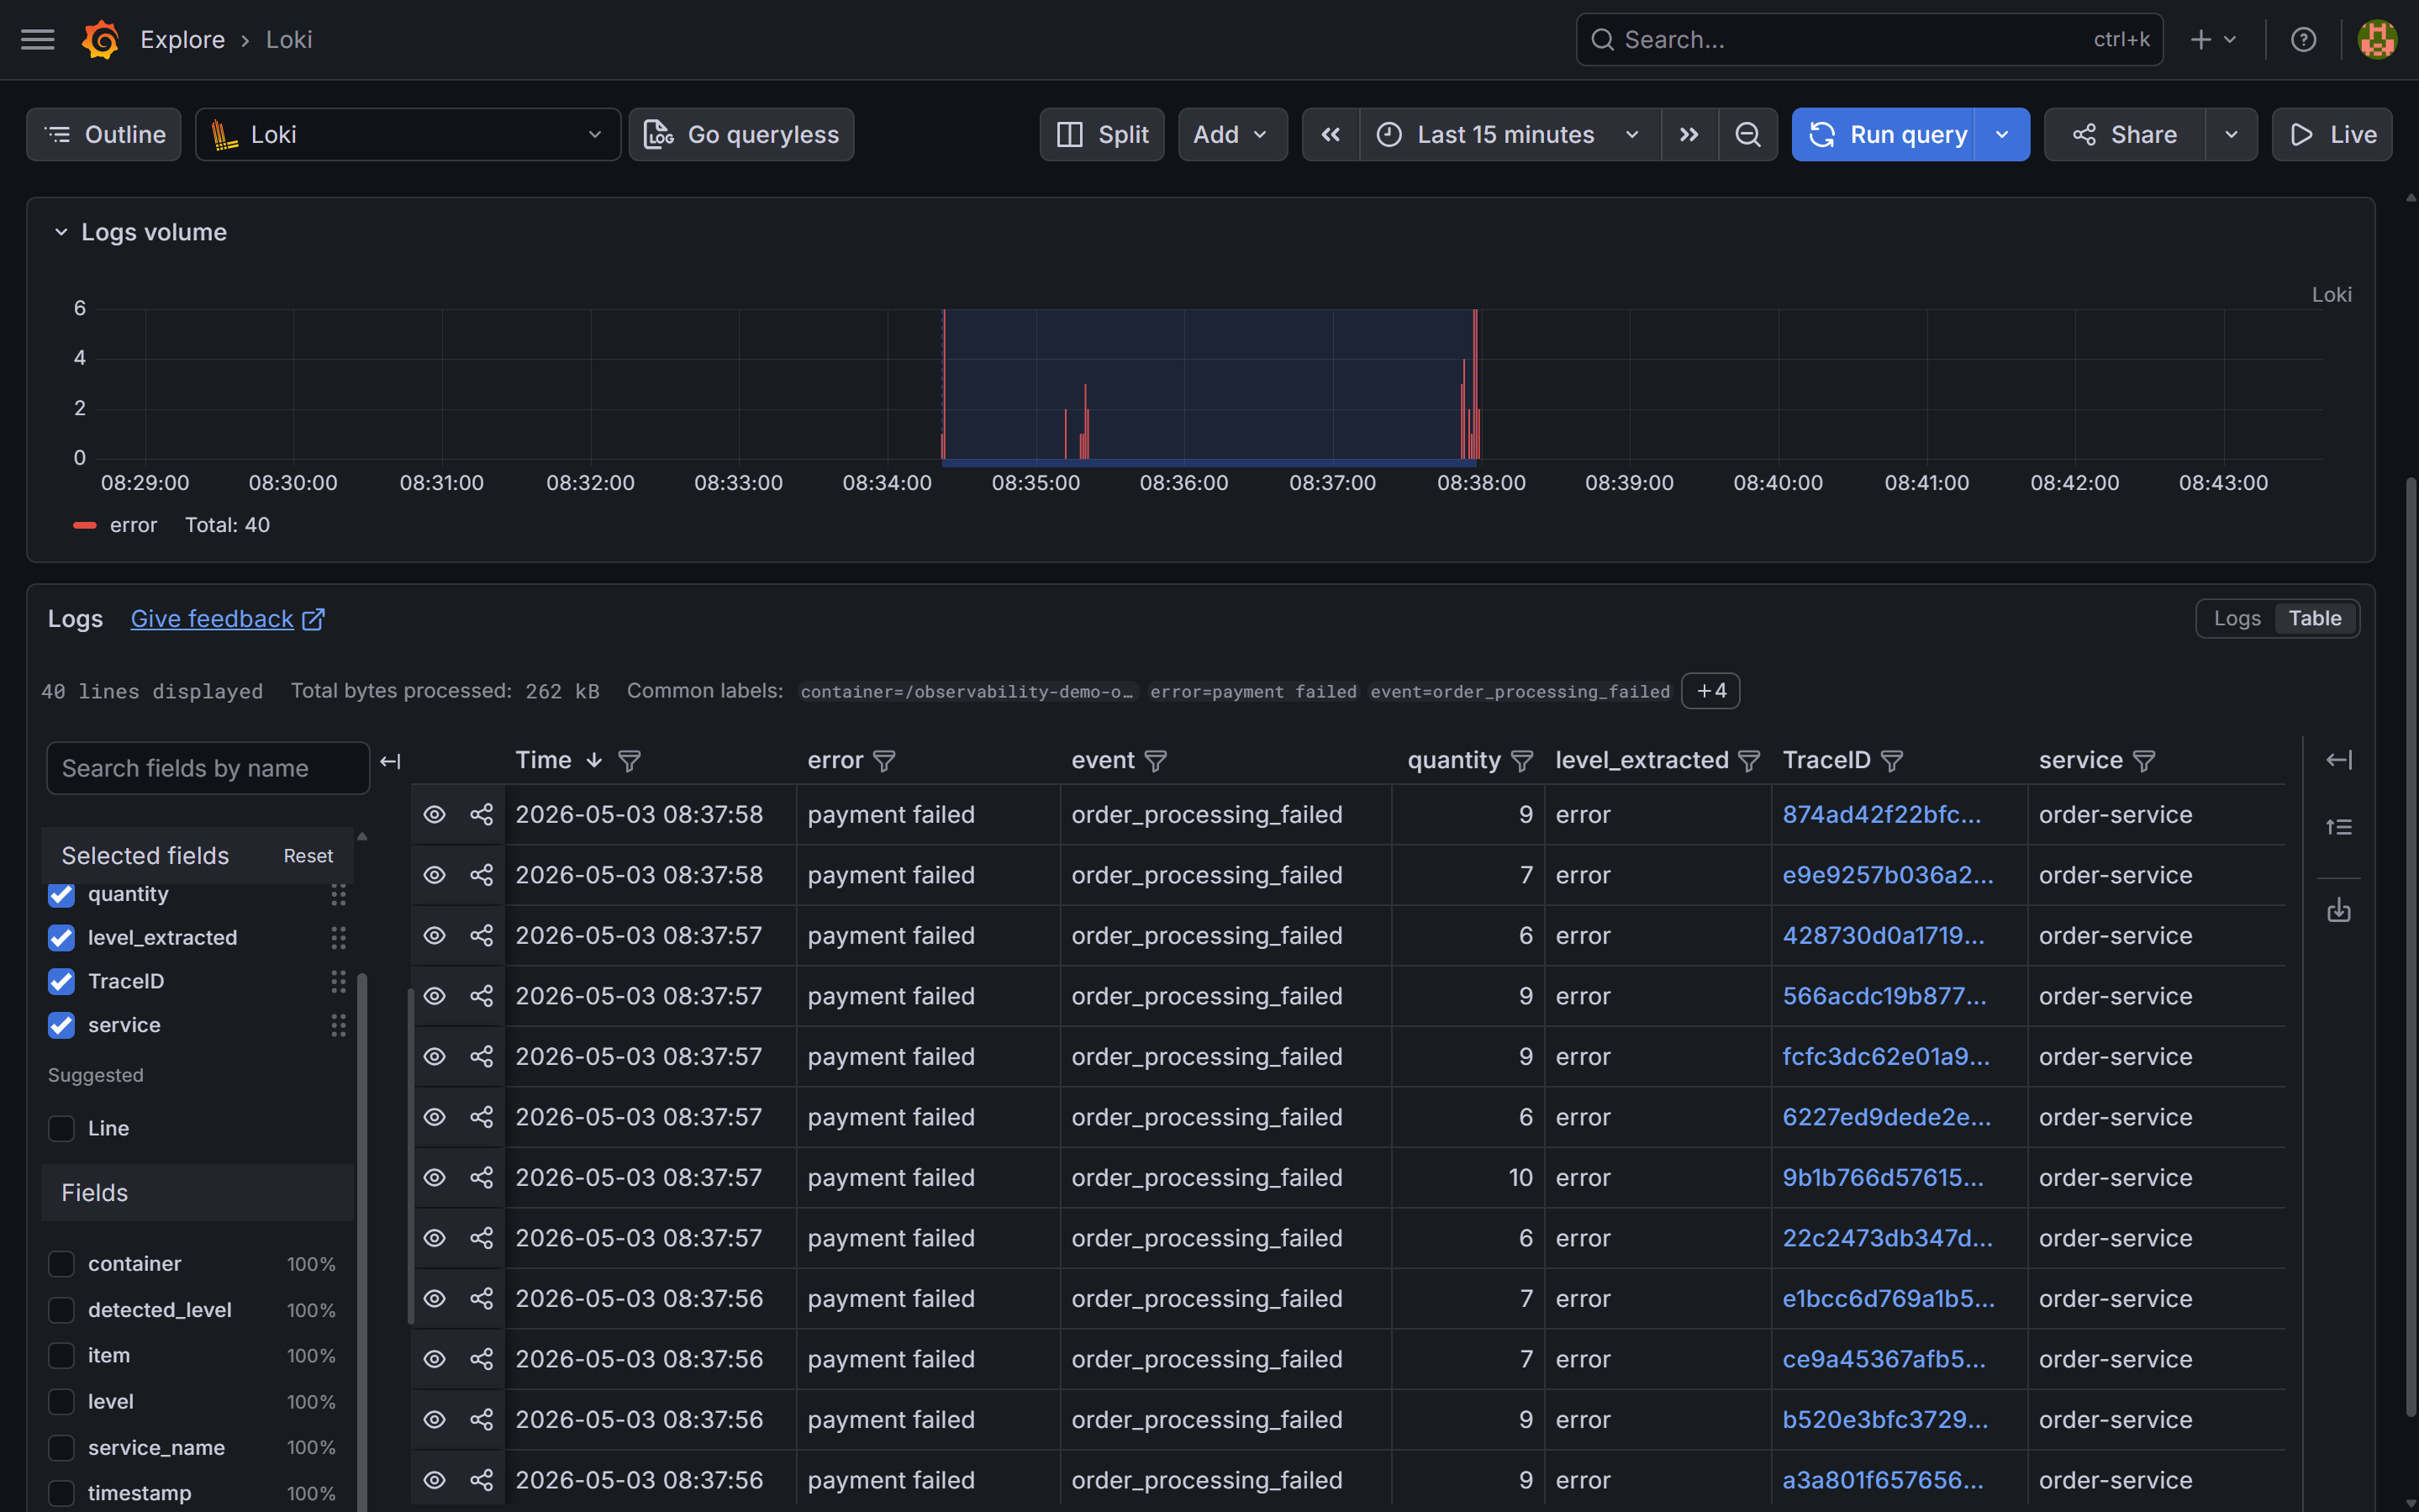
{service="order-service"} | json | level="error", last 15 minutes. The table shows event: order_processing_failed and error: payment failed across all logged errors, with quantities ranging from 6 to 10 — all above the slow-path threshold. The TraceID column links each log line directly to the trace in Tempo.Step 3: Traces — find where the time goes
Click a TraceID value in the Loki log table. Grafana follows the derived field link and opens the trace in Tempo.
The flame graph for a slow trace (quantity=9, payment failed):
[order-service]       POST /orders                0ms ─────────────────────────── 622ms
  [order-service]       process_order             3ms ──────────────────── 386ms
    [order-service]       validate_order          4ms ─── 15ms
    [order-service]       check_inventory        17ms ─── 30ms
      [inventory-service] GET /stock/popular_item
    [order-service]       reserve_inventory       33ms ──────────────── 364ms
      [inventory-service] POST /stock/popular_item/reserve  35ms ─────── 360ms
        [inventory-service] reserve_stock         36ms ─────── 358ms
          [inventory-service] slow_lookup         37ms ─────── 335ms  ← 298ms
            inventory.demand=high
            inventory.item=popular_item
            inventory.quantity=9
    [order-service]       charge_payment         367ms ─── 384ms  ← 502
      [payment-service]   POST /charges           368ms ── 383ms
The slow_lookup span in inventory-service ran for 298ms. The payment span is 15ms — it returned a 502 quickly. The total 622ms comes from inventory blocking the request for 298ms plus overhead from concurrent request queuing.
This is what makes distributed tracing essential: from order-service logs alone, you see payment failed. You might go look at payment-service code. The trace tells you in one view that the payment call itself is fast — it is the inventory reserve that consumes the request’s lifetime.
Compare with a fast trace (quantity=2):
[order-service]       POST /orders                0ms ────── 62ms
  [order-service]       process_order             2ms ────── 58ms
    [order-service]       validate_order          3ms ─ 5ms
    [order-service]       check_inventory         7ms ─ 14ms
      [inventory-service] GET /stock/popular_item
    [order-service]       reserve_inventory      16ms ─── 38ms
      [inventory-service] POST /stock/popular_item/reserve  17ms ── 36ms
        [inventory-service] reserve_stock         18ms ── 35ms
          [inventory-service] slow_lookup         19ms ── 37ms  ← 18ms, normal
    [order-service]       charge_payment          40ms ─── 55ms
      [payment-service]   POST /charges           41ms ── 54ms
    [order-service]       send_notification       57ms ─ 59ms
      [notification-service] POST /notify         57ms ─ 59ms
slow_lookup took 18ms for quantity=2. Without the inventory.demand attribute on the span, this would still be findable — the span duration is the signal. With the attribute, the code path that triggered the slow path is immediately obvious.
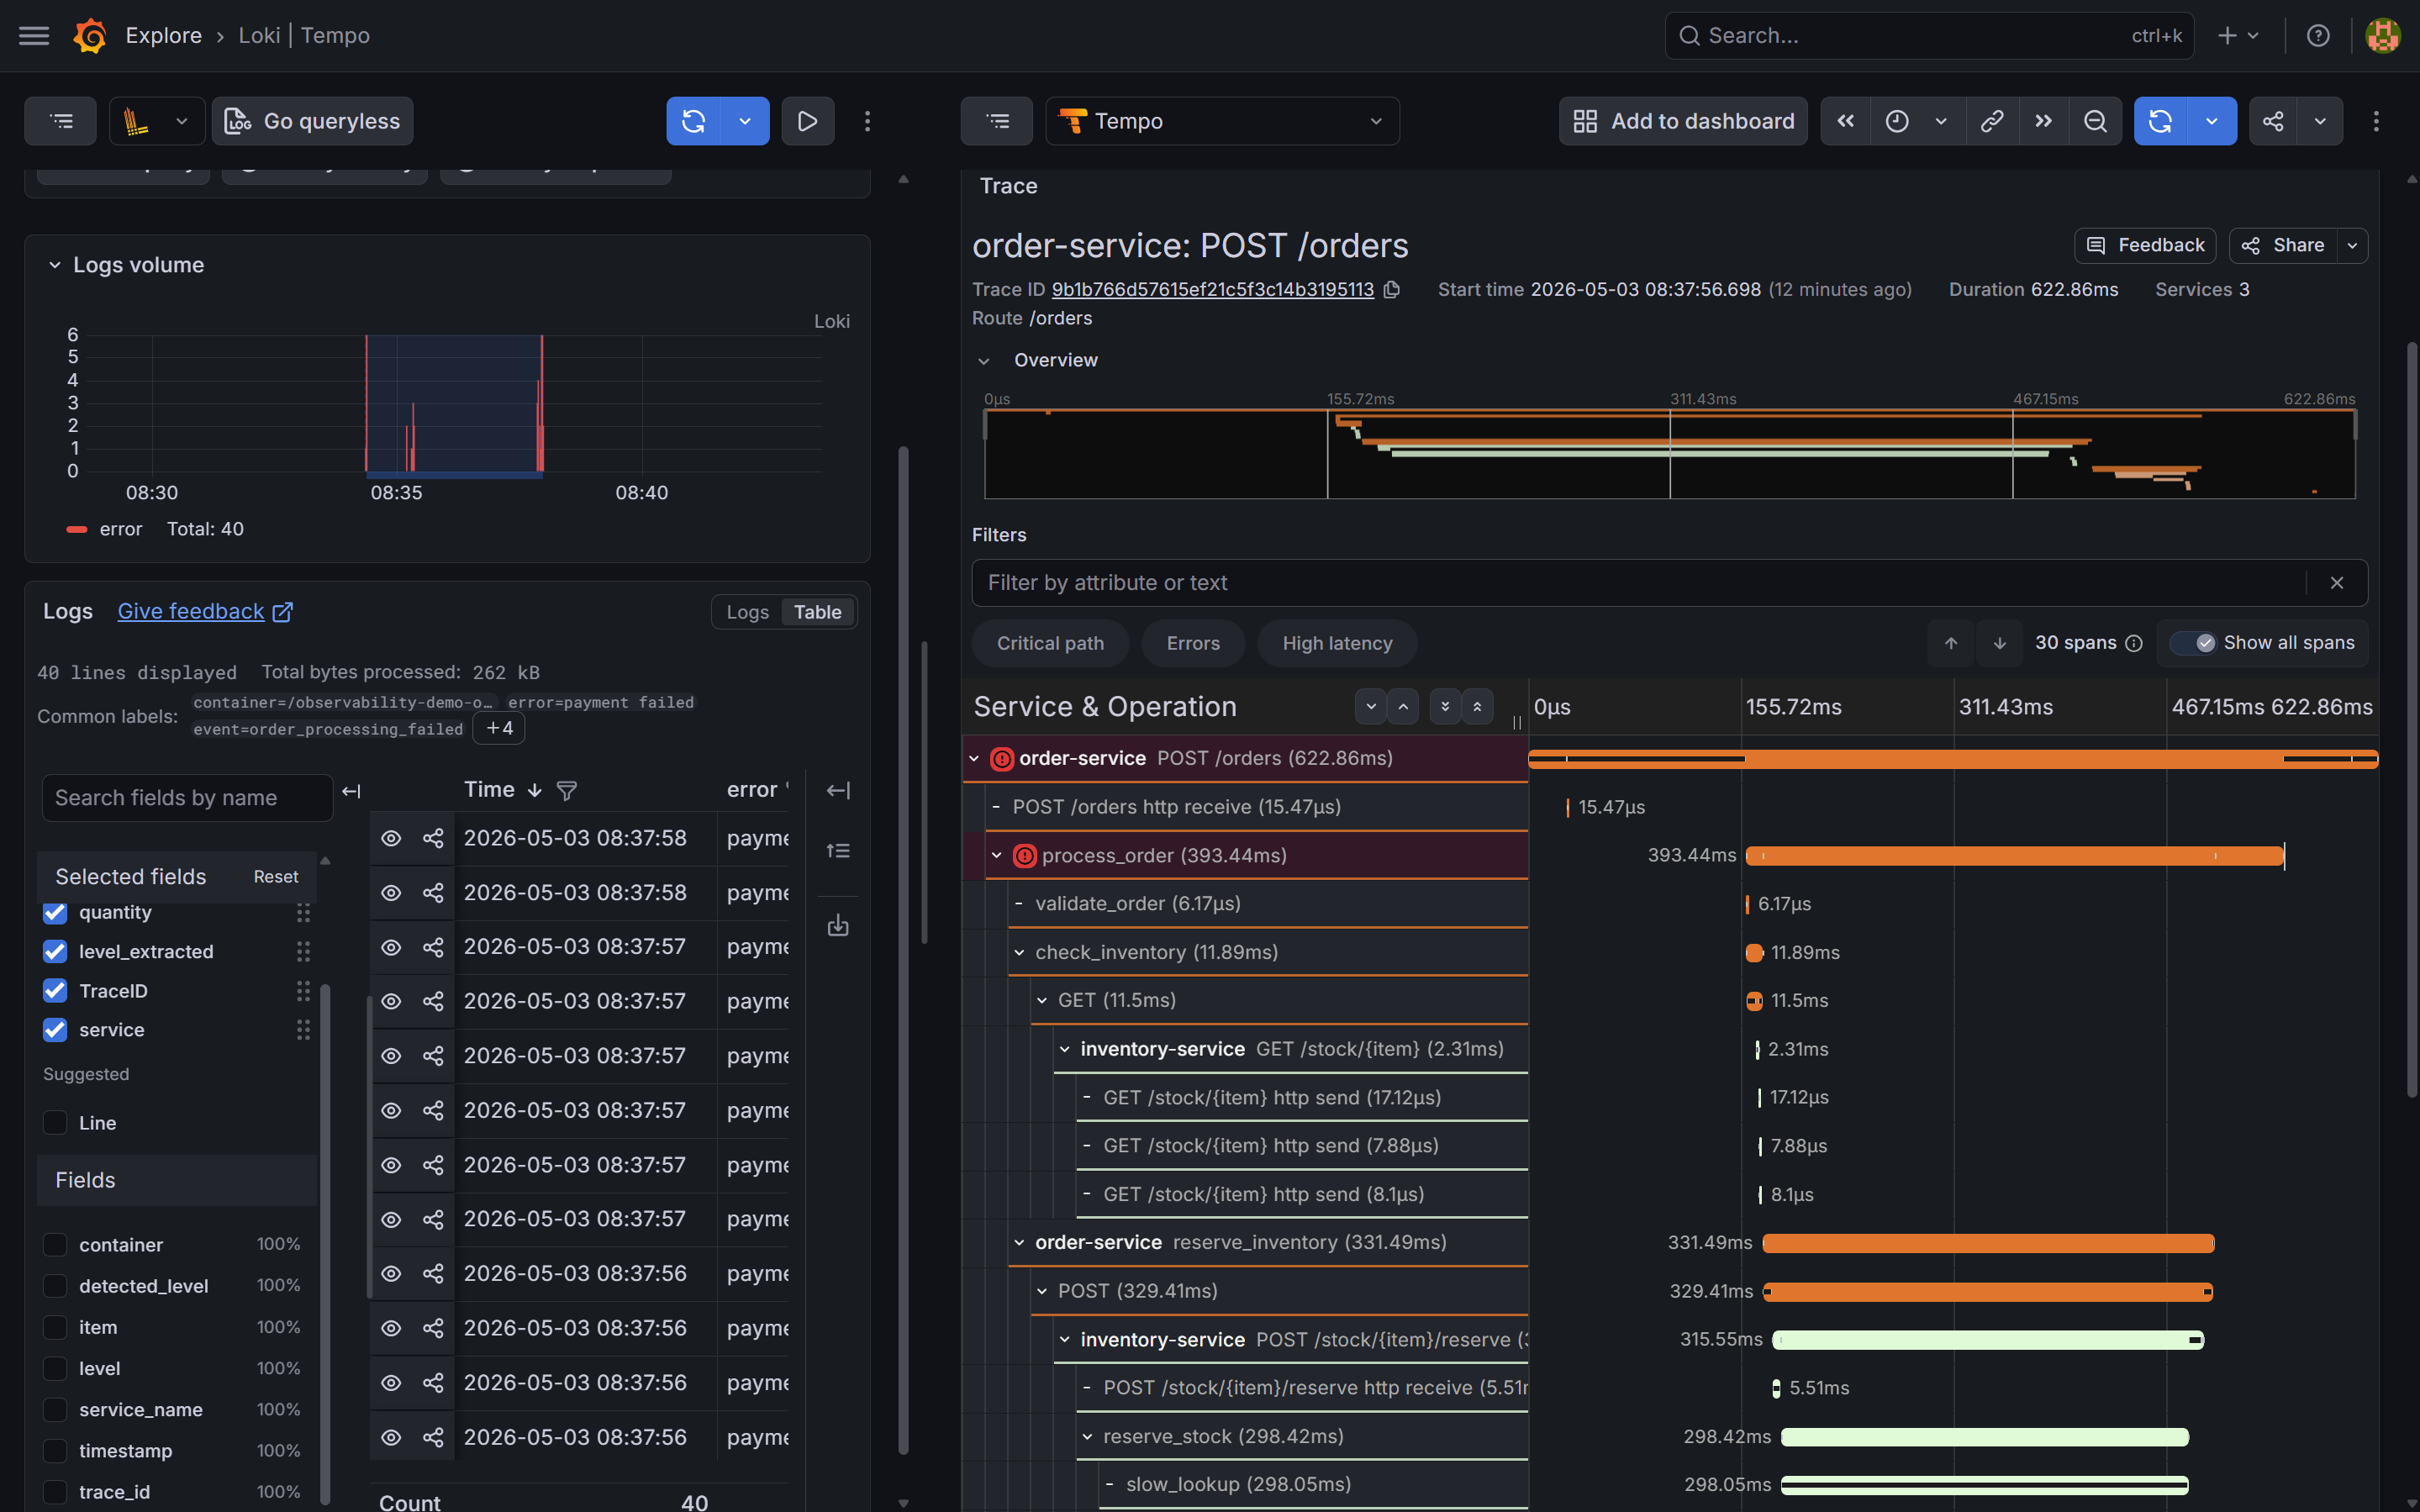
slow_lookup span inside inventory-service is the wide bar — ~298ms out of 622ms total. The charge_payment call to payment-service is a thin sliver on the right: it returned a 502 in ~15ms. The span detail panel shows inventory.demand=high and inventory.quantity=9. The log said "payment failed"; the trace says the bottleneck is in inventory.Step 4: Exemplars — linking metrics to specific traces
Open the service dashboard. In the Request Latency time series panel, look for small diamond markers on the p99 line during the spike — click one to jump directly to the trace that was sampled at that latency value.
Exemplars are a Prometheus feature: each histogram observation can carry an attached traceID. Grafana renders them as diamonds on time series panels and navigates to Tempo when clicked. Three things need to be in place:
1. Services emit exemplars. Each service’s metrics middleware calls .observe() with the current trace ID:
span = otel_trace.get_current_span()
ctx = span.get_span_context()
if ctx.is_valid:
    trace_id = format(ctx.trace_id, "032x")
    REQUEST_LATENCY.labels(...).observe(duration, exemplar={"traceID": trace_id})
else:
    REQUEST_LATENCY.labels(...).observe(duration)
The /metrics endpoint must also serve OpenMetrics format — the default Prometheus text format silently drops exemplar data on scrape:
from prometheus_client import REGISTRY
from prometheus_client.openmetrics.exposition import generate_latest

@app.get("/metrics")
def metrics():
    return Response(generate_latest(REGISTRY), media_type="application/openmetrics-text; version=1.0.0; charset=utf-8")
2. Prometheus stores them. The demo stack already passes --enable-feature=exemplar-storage to Prometheus in docker-compose.yml.
3. The Grafana panel has exemplars enabled. In the panel JSON, each target that queries a histogram needs "exemplar": true. The Request Latency panel in grafana/dashboards/service.json has this set on all three quantile targets (p50, p95, p99).
The Grafana datasource config in grafana/provisioning/datasources/datasources.yml routes exemplar trace IDs to the Tempo datasource:
jsonData:
  exemplarTraceIdDestinations:
    - name: traceID
      datasourceUid: tempo
With all three in place, the diamond markers on the p99 line during the incident are each a direct link to one of the slow traces — no log searching required.
Step 5: Root cause and fix
Two root causes, found in order:
Latency: inventory-service’s slow_lookup function takes 270ms+ for high-demand items (quantity > 5). Under 100 concurrent requests all hitting this path, the thread pool backs up — requests wait behind each other, pushing p99 to 2.38s. In a real system this would indicate something like a missing index causing a sequential table scan, or a cache miss falling back to a slow external API.
Errors: payment-service has a 5% random failure rate. Under normal traffic this burns the error budget slowly. The burst of 100 orders pushed the absolute error count high enough to trip the burn-rate alert.
The log said “payment failed” and pointed at the wrong service. The trace said “slow_lookup in inventory” and found the root cause.
The fix for the latency defect:
# inventory-service/main.py — before: slow path for high-demand items
latency = 0.27 if req.quantity > 5 else 0.02
time.sleep(latency + random.uniform(0, 0.03))

# After: constant time regardless of demand
time.sleep(0.02 + random.uniform(0, 0.01))
The fix is in inventory-service, not in payment-service or order-service. Without distributed tracing, the log evidence alone would have sent you in the wrong direction.
Deploy the fix. Within one scrape interval (15 seconds), Prometheus collects new metrics from inventory-service. The reserve p99 drops from 495ms to ~25ms. Within one evaluation interval, the SLO burn-rate condition clears. Within resolve_timeout (5 minutes), Alertmanager sends a resolved notification to Slack.
Watch the dashboards recover:
order-servicep99 latency returns to ~60ms baselineinventory-servicePOST /stock/{item}/reservep99 drops from 495ms to ~25msorders_in_flightgauge drains to zero- SLI recording rules return above threshold
The error rate stabilises at the ~5% baseline from payment failures — a separate pre-existing issue, now visible without the latency noise masking it.
The investigation workflow
The full chain, top to bottom:

Each step narrows the problem. Metrics give you scope. Logs give you examples. Traces give you causation. You almost never need all three to find the problem — but having all three means you always have a path forward regardless of where the evidence is.
What you have now
Every component in the stack:
| Component | Purpose |
|---|---|
| Prometheus | Stores metrics, evaluates alert rules, serves PromQL |
| Node Exporter | Host-level CPU, memory, disk, network |
| cAdvisor | Per-container resource usage |
| Alertmanager | Routes alerts to Slack, handles grouping and inhibition |
| Grafana | Dashboards, Explore, cross-signal navigation |
| Loki | Log storage and LogQL queries |
| Promtail | Ships container logs to Loki via Docker SD |
| Tempo | Trace storage and TraceQL queries, Service Graph |
| OTel Collector | Receives traces from all four services, forwards to Tempo |
| order-service | Entry point — orchestrates the full order flow |
| inventory-service | Stock management — the service where the root cause lived |
| payment-service | Payment processing — ~5% random failure rate |
| notification-service | Order confirmations — fire-and-forget |
The full source is at github.com/mguarinos/observability-demo. Clone it, run docker compose up -d, generate traffic, and the entire stack is live.
The stack is intentionally small and self-contained. Every tool used here has a hosted equivalent if you want to skip the operational overhead: Grafana Cloud runs Loki, Tempo, and Grafana as a service with a generous free tier. Prometheus can be replaced with Grafana Mimir for long-term storage. The instrumentation code in the Python service works without modification — only the exporter endpoints change.