
Observability for your Ollama stack: Prometheus, Grafana, Loki, and structured logs
Contents
This is part 8 of the Ollama infra series. We have Ollama behind nginx (part 2), a BullMQ queue (part 3), a UI (part 4), a voice interface (part 5), Open WebUI extensions (part 6), and Claude Code integration (part 7). Now we add the full observability layer: metrics from the queue, metrics derived from nginx logs, and log aggregation — all wired into Grafana.
What to measure
For an LLM inference stack, the metrics that matter are different from a typical web service:
| Signal | Why it matters |
|---|---|
| Tokens per second | Primary throughput measure — varies by model and prompt length |
| Generation latency (p50, p95) | User-facing response time, per model |
| Queue depth | Backpressure signal — are requests piling up? |
| Worker concurrency saturation | Are workers at capacity? |
| Error rate | Failed generations, timeouts |
| TTFB from nginx | Cold model load shows up here as an outlier |
| Request rate by route | How much traffic goes to queue vs direct vs UI |
| Bandwidth | Response size over time, correlates with token count |
Stack overview
Prometheus  ──scrapes──▶  queue exporter  (port 9091, same process as worker)
                          nginx exporter  (port 9113, Docker container)
                          promtail        (port 9080, Docker container)

Promtail    ──tails──▶    /var/log/nginx/inference-access.log
            ──pushes──▶   Loki

Grafana     ──queries──▶  Prometheus  (metrics)
                          Loki        (logs)
All of Prometheus, Grafana, Loki, and Promtail run via Docker Compose.
Docker Compose
docker-compose.yml:
services:
  prometheus:
    image: prom/prometheus:latest
    restart: always
    ports:
      - "127.0.0.1:9090:9090"
    volumes:
      - ./prometheus.yml:/etc/prometheus/prometheus.yml
      - prometheus-data:/prometheus
    command:
      - "--config.file=/etc/prometheus/prometheus.yml"
      - "--storage.tsdb.retention.time=30d"
    extra_hosts:
      - "host.docker.internal:host-gateway"

  grafana:
    image: grafana/grafana:latest
    restart: always
    ports:
      - "127.0.0.1:3002:3000"
    volumes:
      - grafana-data:/var/lib/grafana
    environment:
      - GF_SECURITY_ADMIN_PASSWORD=change-this
      - GF_USERS_ALLOW_SIGN_UP=false

  loki:
    image: grafana/loki:latest
    restart: always
    ports:
      - "127.0.0.1:3100:3100"
    volumes:
      - ./loki-config.yml:/etc/loki/local-config.yaml
      - loki-data:/loki
    command: -config.file=/etc/loki/local-config.yaml

  promtail:
    image: grafana/promtail:latest
    restart: always
    volumes:
      - ./promtail-config.yml:/etc/promtail/config.yml
      - /var/log/nginx:/var/log/nginx:ro
      - promtail-positions:/tmp
    command: -config.file=/etc/promtail/config.yml

volumes:
  prometheus-data:
  grafana-data:
  loki-data:
  promtail-positions:
On Linux, Docker does not automatically add host.docker.internal as it does on Docker Desktop (Mac/Windows). The extra_hosts entry maps it to host-gateway — the host’s Docker bridge IP — so containers can reach processes listening on the host.
docker compose up -d
Queue metrics exporter
Install the dependency first:
npm install express
We write a small Express server that Prometheus scrapes. It shares a process with the worker so they can share in-memory state — if they were separate PM2 processes each would have its own memory and recordJob calls from the worker would never reach the metrics server’s counters.
All metrics are tracked per model, so you can filter by model in Grafana when you run multiple models.
src/metrics.js:
require("dotenv/config");
const express = require("express");
const { inferenceQueue } = require("./queue");

const app = express();

const latencyBuckets = [500, 1000, 2000, 5000, 10000, 30000, 60000, Infinity];
let errorCount = 0;
const models = {};

function getModel(name) {
  if (!models[name]) {
    models[name] = {
      jobs: 0,
      tokens: 0,
      durationMs: 0,
      latencyCounts: new Array(latencyBuckets.length).fill(0),
    };
  }
  return models[name];
}

function recordJob({ eval_count, total_duration_ms, model, error }) {
  if (error) {
    errorCount++;
    return;
  }
  const m = getModel(model || "unknown");
  m.jobs++;
  m.tokens += eval_count;
  m.durationMs += total_duration_ms;

  const bucket = latencyBuckets.findIndex((b) => total_duration_ms <= b);
  for (let i = bucket; i < latencyBuckets.length; i++) {
    m.latencyCounts[i]++;
  }
}

app.get("/metrics", async (req, res) => {
  const waiting = await inferenceQueue.getWaitingCount();
  const active = await inferenceQueue.getActiveCount();

  const modelNames = Object.keys(models);
  const totalJobs = modelNames.reduce((s, n) => s + models[n].jobs, 0);
  const totalTokens = modelNames.reduce((s, n) => s + models[n].tokens, 0);
  const totalDurationMs = modelNames.reduce((s, n) => s + models[n].durationMs, 0);
  const tokensPerSecond =
    totalDurationMs > 0 ? (totalTokens / (totalDurationMs / 1000)).toFixed(2) : 0;

  const label = (model) => `{model="${model}"}`;

  const lines = [
    "# HELP ollama_queue_waiting Number of jobs waiting in the queue",
    "# TYPE ollama_queue_waiting gauge",
    `ollama_queue_waiting ${waiting}`,

    "# HELP ollama_queue_active Number of jobs currently being processed",
    "# TYPE ollama_queue_active gauge",
    `ollama_queue_active ${active}`,

    "# HELP ollama_jobs_total Total completed inference jobs",
    "# TYPE ollama_jobs_total counter",
    ...modelNames.map((n) => `ollama_jobs_total${label(n)} ${models[n].jobs}`),
    `ollama_jobs_total ${totalJobs}`,

    "# HELP ollama_tokens_total Total tokens generated",
    "# TYPE ollama_tokens_total counter",
    ...modelNames.map((n) => `ollama_tokens_total${label(n)} ${models[n].tokens}`),
    `ollama_tokens_total ${totalTokens}`,

    "# HELP ollama_errors_total Total failed inference jobs",
    "# TYPE ollama_errors_total counter",
    `ollama_errors_total ${errorCount}`,

    "# HELP ollama_tokens_per_second Tokens per second lifetime average",
    "# TYPE ollama_tokens_per_second gauge",
    ...modelNames.map((n) => {
      const tps = models[n].durationMs > 0
        ? (models[n].tokens / (models[n].durationMs / 1000)).toFixed(2)
        : 0;
      return `ollama_tokens_per_second${label(n)} ${tps}`;
    }),
    `ollama_tokens_per_second ${tokensPerSecond}`,

    "# HELP ollama_generation_duration_ms Latency histogram in milliseconds",
    "# TYPE ollama_generation_duration_ms histogram",
    ...modelNames.flatMap((n) => [
      ...latencyBuckets.map((b, i) =>
        `ollama_generation_duration_ms_bucket{model="${n}",le="${b === Infinity ? "+Inf" : b}"} ${models[n].latencyCounts[i]}`
      ),
      `ollama_generation_duration_ms_count${label(n)} ${models[n].jobs}`,
      `ollama_generation_duration_ms_sum${label(n)} ${models[n].durationMs}`,
    ]),
  ];

  res.set("Content-Type", "text/plain; version=0.0.4");
  res.send(lines.join("\n") + "\n");
});

app.listen(9091, "127.0.0.1", () => {
  console.log("Metrics exporter listening on :9091");
});

module.exports = { recordJob };
Require it from src/worker.js so both start in the same process:
require("dotenv/config");
const { Worker } = require("bullmq");
const { connection } = require("./queue");
const { recordJob } = require("./metrics");

// ... worker definition ...

worker.on("completed", (job) => {
  const { total_duration_ms, eval_count } = job.returnvalue;
  console.log(`job ${job.id} done — ${eval_count} tokens in ${total_duration_ms}ms`);
  recordJob(job.returnvalue);
});

worker.on("failed", (job, err) => {
  console.error(`job ${job?.id} failed:`, err.message);
  recordJob({ error: err.message });
});
pm2 start src/worker.js --name ollama-worker
pm2 start src/api.js --name ollama-api
Prometheus scrape configuration
prometheus.yml:
global:
  scrape_interval: 15s

scrape_configs:
  - job_name: ollama_queue
    static_configs:
      - targets: ["host.docker.internal:9091"]

  - job_name: nginx
    static_configs:
      - targets: ["host.docker.internal:9113"]

  - job_name: promtail
    static_configs:
      - targets: ["promtail:9080"]
The ollama_queue and nginx targets reach exporters running on the host via host.docker.internal (mapped via extra_hosts in the Compose file). The promtail target uses the Docker Compose service name directly since both run inside the same Compose network.
Infrastructure exporters
nginx exporter — parses nginx’s stub_status page.
Add a dedicated internal server block to /etc/nginx/sites-available/inference (the same file that contains your main server { listen 443 ssl; ... } block). Place it at the bottom of the file, outside the existing server blocks:
# Internal metrics endpoint — not exposed to the internet
server {
    listen 127.0.0.1:8099;

    location /stub_status {
        stub_status;
    }
}
This server listens on localhost only and has no TLS, so the exporter can scrape it over plain HTTP without any certificate configuration. Reload nginx:
nginx -t && systemctl reload nginx
Start the exporter pointing at the internal port:
docker run -d \
  --name nginx-exporter \
  --restart always \
  --add-host=host.docker.internal:host-gateway \
  -p 127.0.0.1:9113:9113 \
  nginx/nginx-prometheus-exporter:latest \
  --nginx.scrape-uri=http://host.docker.internal:8099/stub_status
Loki and Promtail
Loki stores the logs. Promtail tails nginx’s JSON access log, ships each line to Loki, and also extracts Prometheus metrics from the log fields in the same pipeline.
The Promtail pipeline assumes nginx writes structured JSON logs. The log_format json_combined definition and the access_log directive that uses it were set up in part 2.
loki-config.yml:
auth_enabled: false

server:
  http_listen_port: 3100

common:
  path_prefix: /loki
  storage:
    filesystem:
      chunks_directory: /loki/chunks
      rules_directory: /loki/rules
  replication_factor: 1
  ring:
    kvstore:
      store: inmemory

schema_config:
  configs:
    - from: 2020-10-24
      store: tsdb
      object_store: filesystem
      schema: v13
      index:
        prefix: index_
        period: 24h

limits_config:
  reject_old_samples: false
promtail-config.yml:
server:
  http_listen_port: 9080
  grpc_listen_port: 0

positions:
  filename: /tmp/positions.yaml

clients:
  - url: http://loki:3100/loki/api/v1/push

scrape_configs:
  - job_name: nginx
    static_configs:
      - targets:
          - localhost
        labels:
          job: nginx
          __path__: /var/log/nginx/inference-access.log
    pipeline_stages:
      - json:
          expressions:
            status: status
            method: method
            uri: uri
            request_time: request_time
            upstream_response_time: upstream_response_time
            upstream_header_time: upstream_header_time
            upstream_connect_time: upstream_connect_time
            bytes_sent: bytes_sent

      # Normalise URI into a route label
      - template:
          source: route
          template: >-queuedirectspeachesinternalui- labels:
          status:
          method:
          route:

      - metrics:
          nginx_request_duration_seconds:
            type: Histogram
            description: "Total nginx request duration"
            source: request_time
            config:
              buckets: [0.05, 0.1, 0.25, 0.5, 1, 2, 5, 10, 30]

          nginx_ttfb_seconds:
            type: Histogram
            description: "Time to first byte from upstream (upstream_header_time)"
            source: upstream_header_time
            config:
              buckets: [0.05, 0.1, 0.25, 0.5, 1, 2, 5, 10, 30]

          nginx_upstream_response_seconds:
            type: Histogram
            description: "Upstream total response time"
            source: upstream_response_time
            config:
              buckets: [0.05, 0.1, 0.25, 0.5, 1, 2, 5, 10, 30]

          nginx_upstream_connect_seconds:
            type: Histogram
            description: "Upstream connection establishment time"
            source: upstream_connect_time
            config:
              buckets: [0.001, 0.005, 0.01, 0.05, 0.1, 0.5, 1]

          nginx_bytes_sent_total:
            type: Counter
            description: "Total bytes sent to clients"
            source: bytes_sent
            config:
              action: add
The route label normalises raw URIs into four buckets — queue, direct, speaches, ui — so you can split traffic by access pattern in dashboards without high cardinality from individual paths.
Promtail prefixes pipeline-defined metrics with promtail_custom_, so the actual metric names in Prometheus are promtail_custom_nginx_request_duration_seconds, promtail_custom_nginx_ttfb_seconds, etc.
Grafana
Open Grafana at http://your-server-ip:3002 and log in with the admin password you set in docker-compose.yml.
Add data sources (Connections → Data sources → Add new):
- Prometheus — URL:
http://prometheus:9090, enable “Default” - Loki — URL:
http://loki:3100
Use the internal service names (prometheus, loki) — Grafana is inside the same Compose network and can reach both directly.
Create dashboards (Dashboards → New → New dashboard). Build two separate ones:
Dashboard 1: Ollama Queue
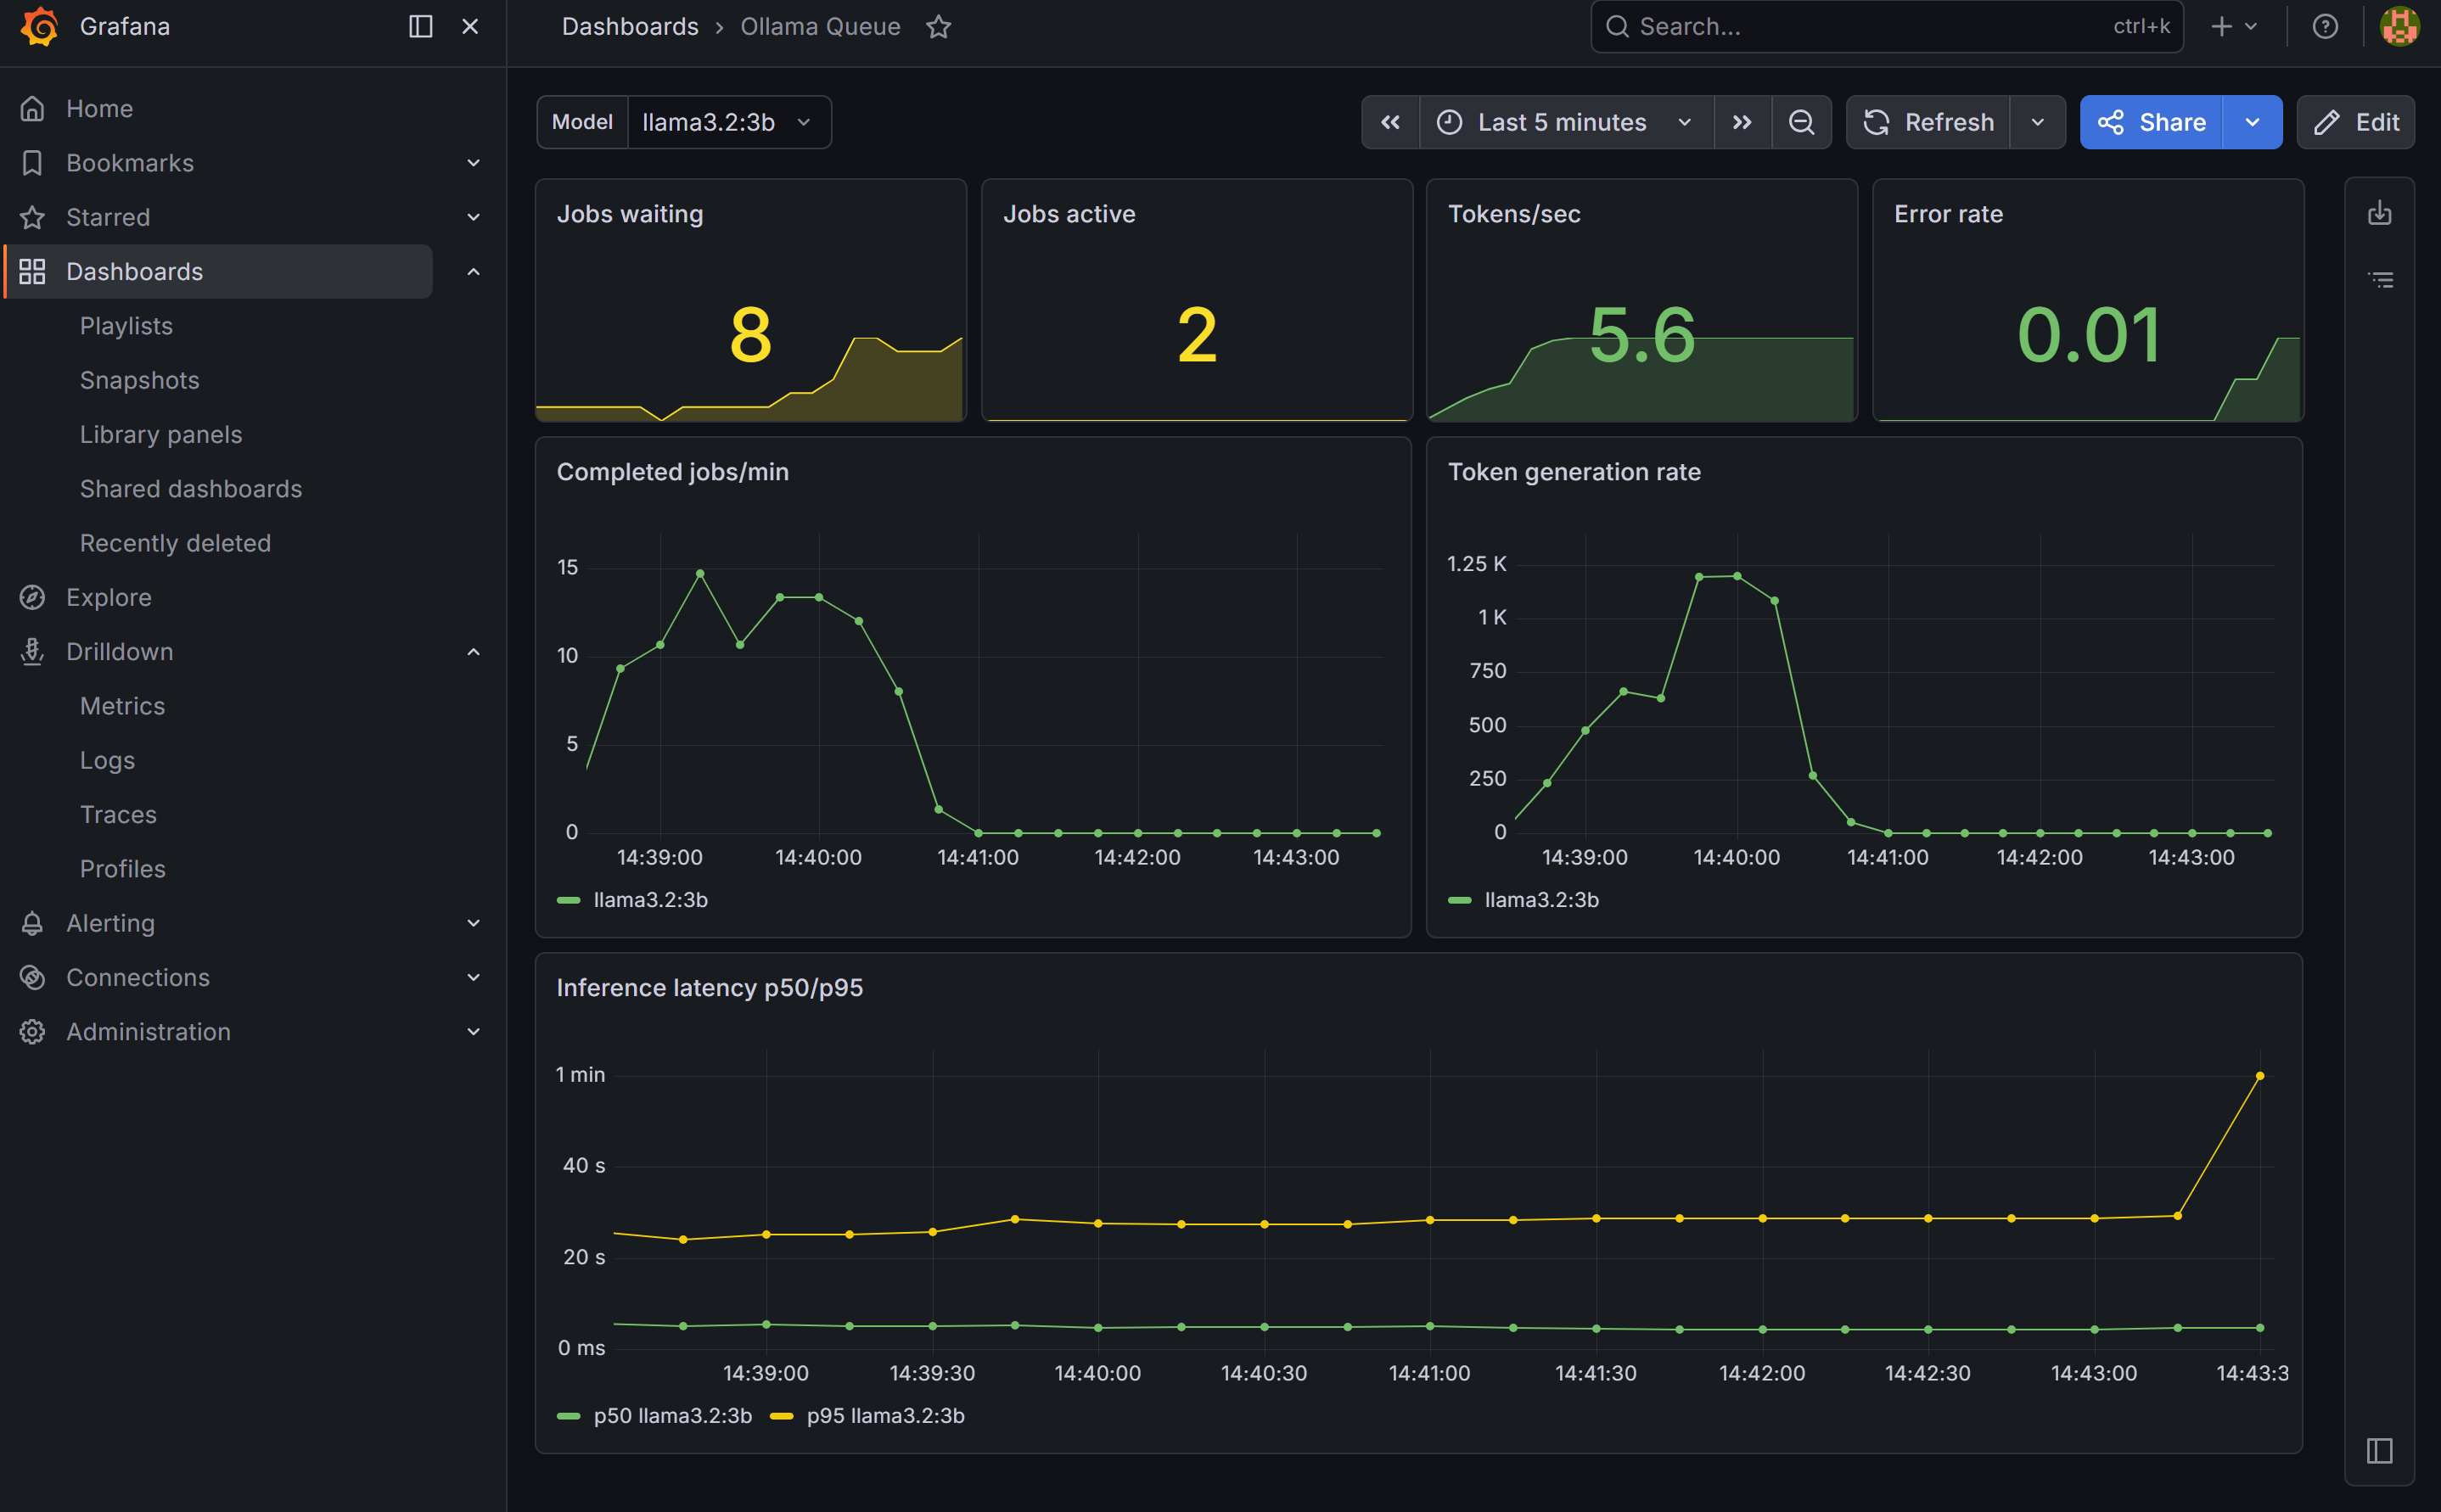
Create a dashboard variable first: go to Dashboard settings → Variables → Add variable. Set type to Query, data source to Prometheus, and query to label_values(ollama_jobs_total{model!=""}, model). Name it model and enable “All” as an option. This gives you a Model dropdown that filters all panels by model — new models appear automatically as you add them.
Panels to add:
- Stat — Jobs waiting and active (current queue state)
- Stat — Tokens/sec and error rate
- Time series — Jobs per minute and token rate, broken down by model
- Time series — Inference latency p50 and p95 per model
Dashboard 2: nginx / Open WebUI
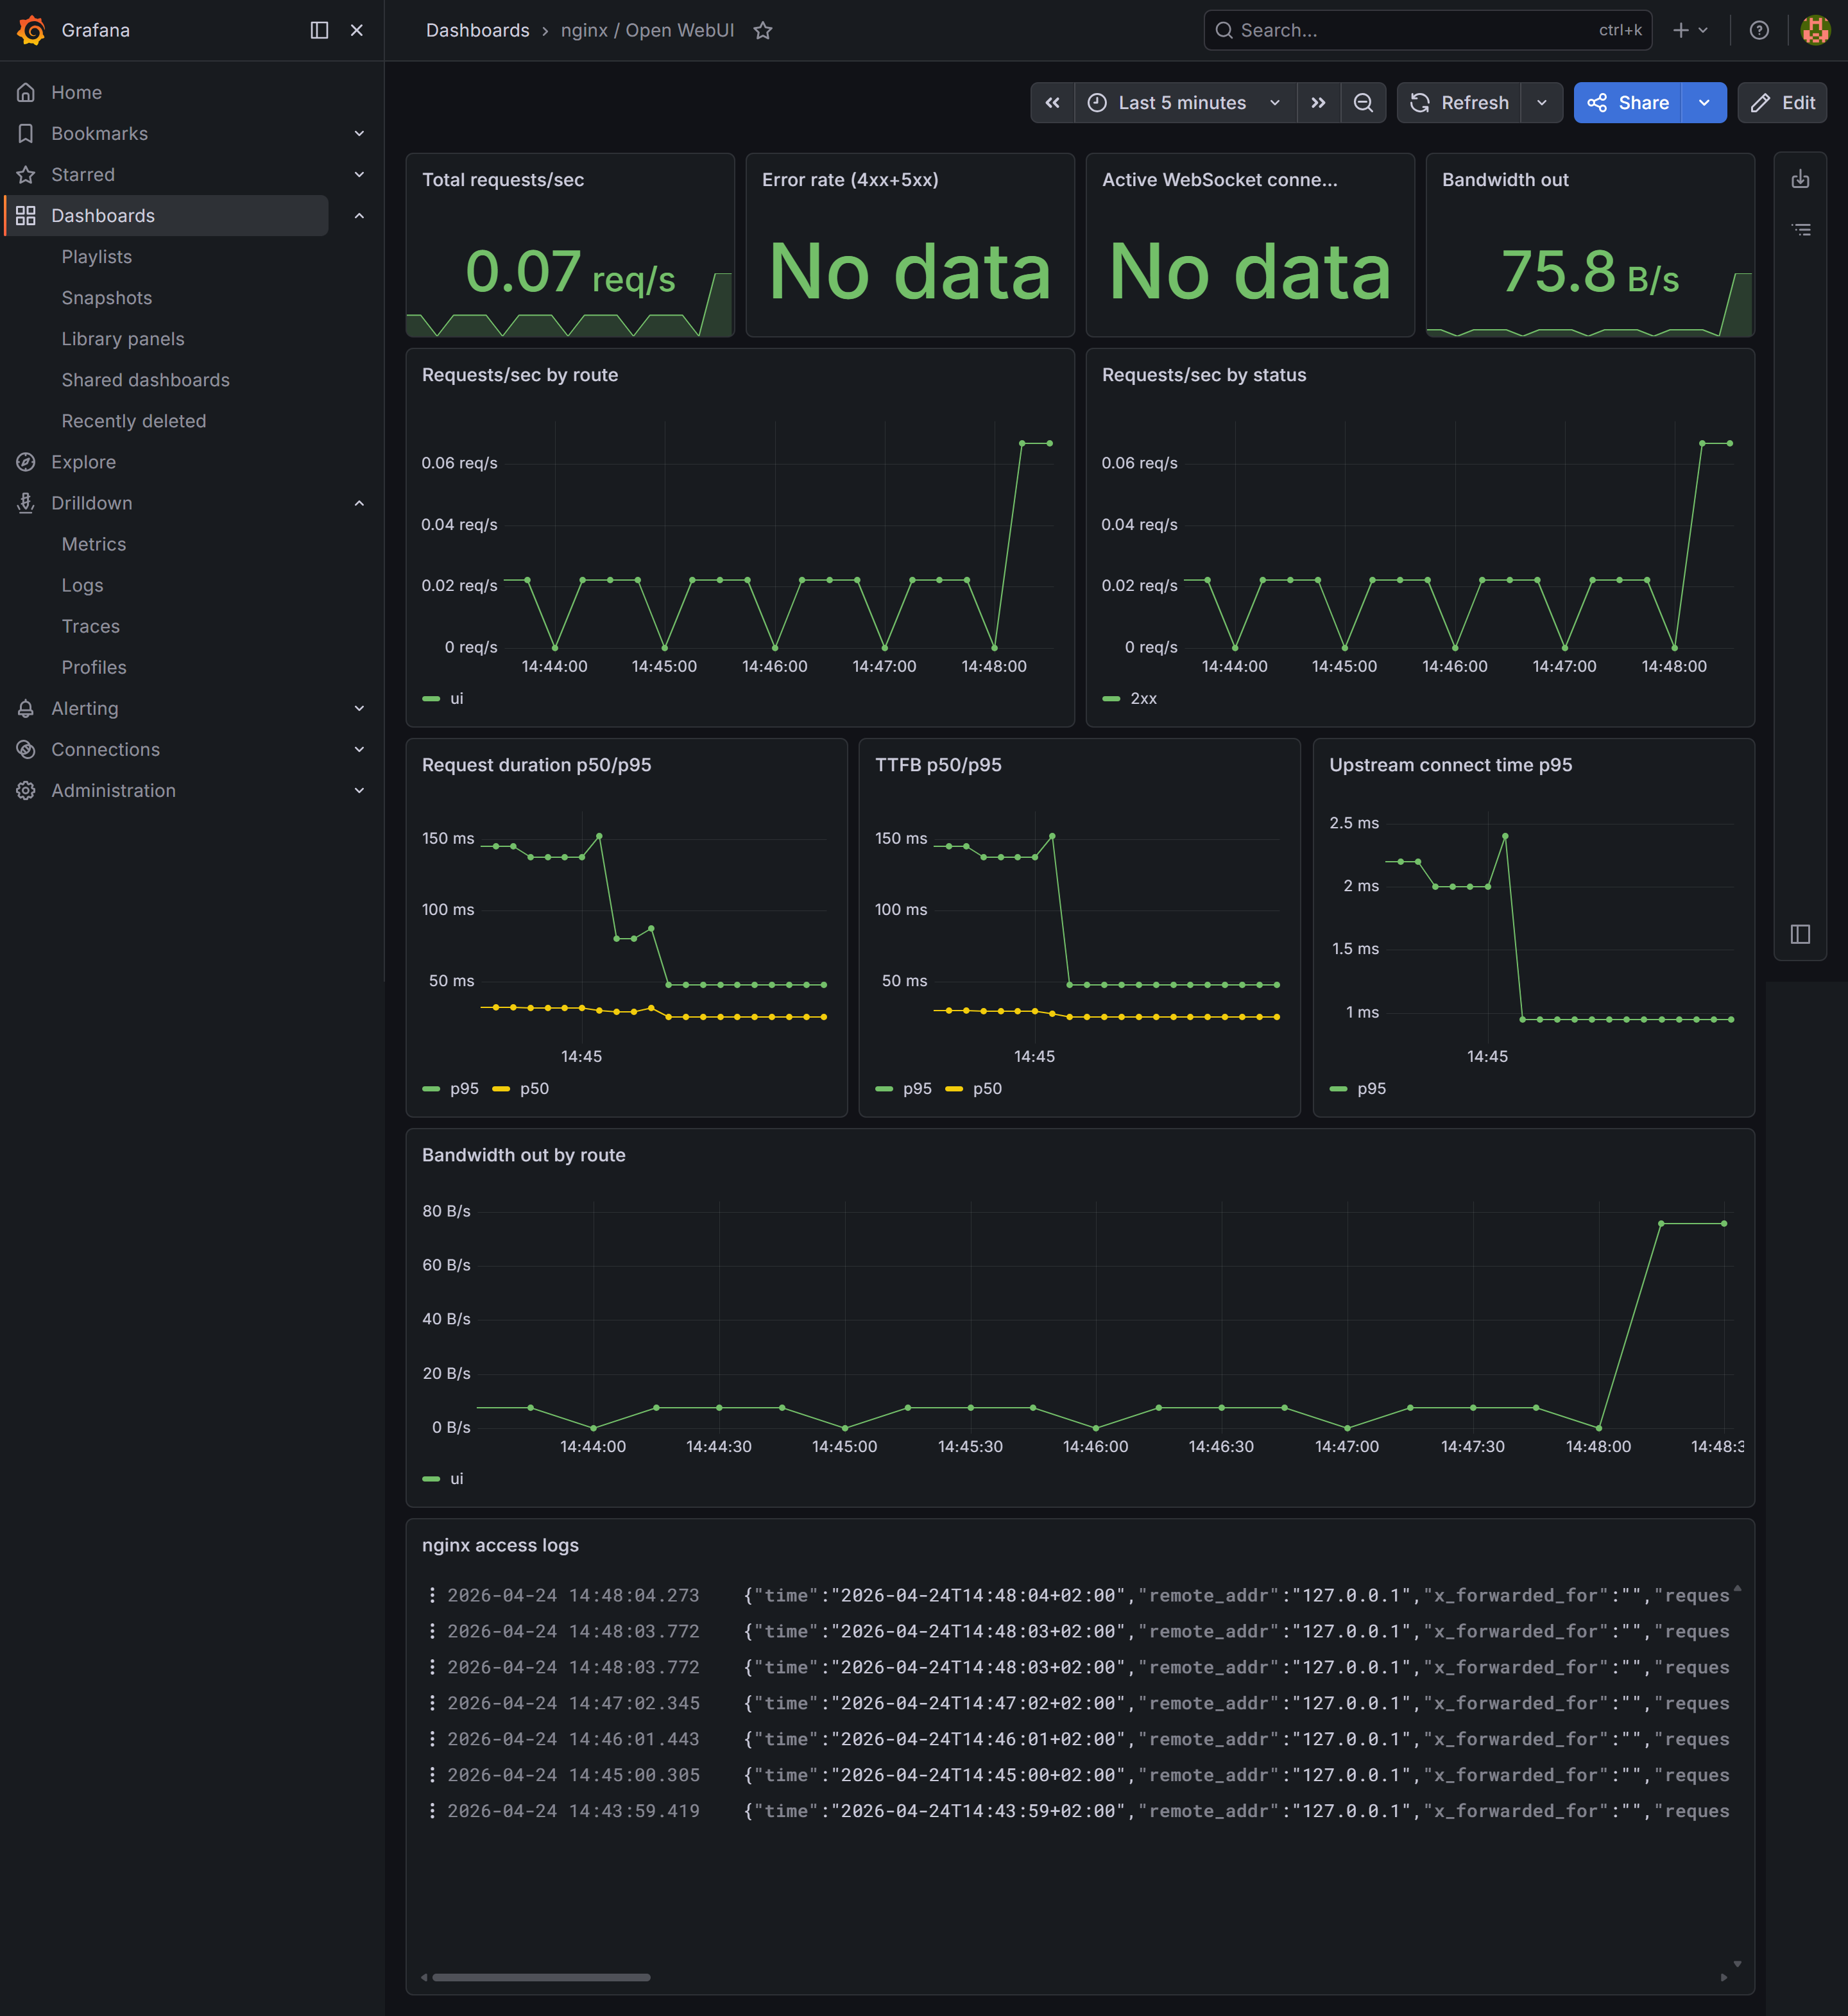
Panels to add:
- Stat — Total requests/sec, error rate (4xx+5xx), bandwidth out
- Time series — Request rate broken down by route (
ui,queue,direct) and by status code (2xx, 4xx, 5xx) - Time series — Request duration and TTFB (time to first byte) p50/p95 — cold model loads show up as outliers in TTFB since Ollama loads weights into VRAM before returning the first token
- Time series — Upstream connect time p95 — spikes indicate connection pool pressure
- Time series — Outbound bandwidth by route
- Logs — set data source to Loki, which streams the nginx access log live and lets you filter by any field
What you have now
- Queue metrics per model: jobs/min, tokens/sec, latency histogram, error rate
- nginx connection metrics: total requests, active connections (from
stub_status) - nginx log-derived metrics: request duration, TTFB, upstream response time, upstream connect time, bandwidth — all labelled by route and status
- Log aggregation: nginx access logs searchable in Grafana via Loki
- Two dashboards: one focused on inference load (filterable by model), one on web traffic